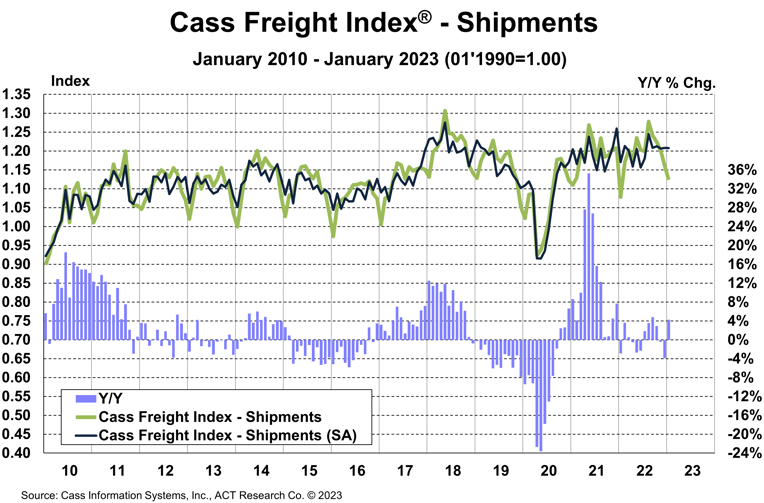
Amidst a mode shift to truckload, shipment volumes fell 3.2% m/m in January
Yet in a moment of unusual stability, overall rates were eerily steady, Cass Transportation Index Reports
Truckload Brings It
| January 2023 | Year-over-year change | 2-year stacked change | Month-to-month change | Month-to-month change (SA*) | |
| Cass Freight Index – Shipments | 1.124 | 4.3% | 1.3% | -3.2% | 0.0% |
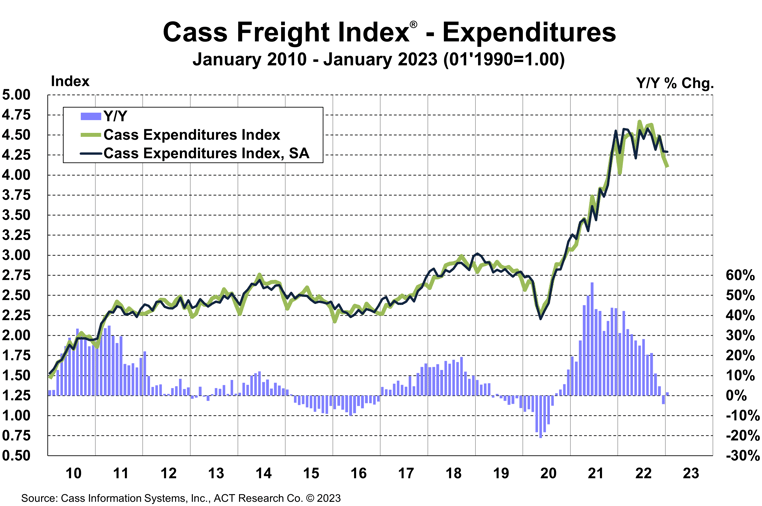
| Cass Freight Index – Expenditures | 4.096 | 1.7% | 33.4% | -3.2% | -0.2% |
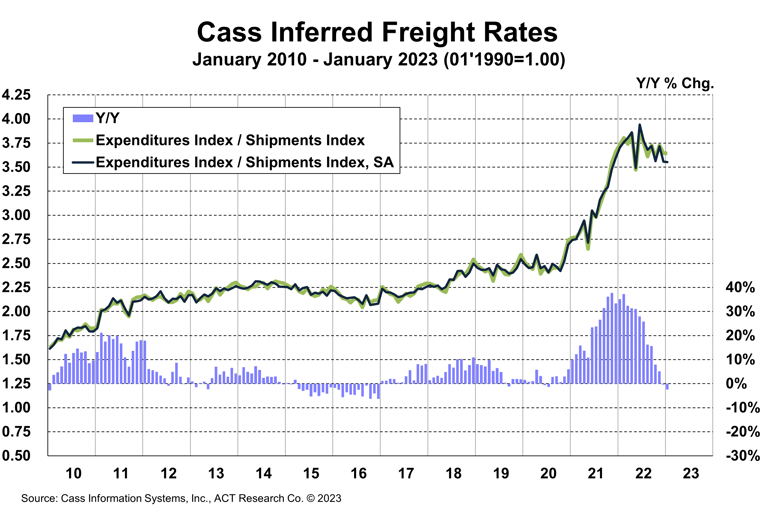
| Cass Inferred Freight Rates | 3.644 | -2.5% | NA | 0.0% | -0.1% |
| Truckload Linehaul Index | 149.23 | -5.6% | 6.5% | -0.9% | — |
* SA = seasonally adjusted
Cass Freight Index – Shipments
The shipments component of the Cass Freight Index® fell 3.2% m/m in January. On a seasonally adjusted (SA) basis, the index was unchanged from December, better than expected with support from mild weather and improving auto production.
- The Omicron wave of COVID was in full swing last January, which led to widespread absenteeism and supply-side pressure on shipments, and weather was more severe last January. So, the y/y comparison isn’t too meaningful, but the index rose 4.3% y/y.
- With normal seasonal patterns, the shipments component will be flat y/y in February and March.
- After a soft holiday season with inventories overstocked and imports falling sharply, the outlook remains cautious, but volumes are on a high plateau.
There has been a considerable increase in the proportion of truckload (TL) freight over the past several months, suggesting freight is migrating to TL from other modes. This fits with the robust growth in truckload capacity metrics. The resilience of volumes thus partly reflects share gains by the truckload sector, particularly contract and dedicated freight currently, amid declines in less-than-truckload (LTL) and intermodal volumes.

See the methodology for the Cass Freight Index.
Cass Freight Index – Expenditures
The expenditures component of the Cass Freight Index, which measures the total amount spent on freight, fell 3.2% m/m in January, but returned to 1.7% y/y growth on an easy comparison.
Matching the shipment decline of 3.2% m/m in January, we can infer that rates were unchanged from December (see our inferred rates data series below).
- On an SA basis, expenditures fell 0.2% m/m in January, with shipments flat and rates down slightly, after a 4.2% m/m decline in December.
This index includes changes in fuel, modal mix, intramodal mix, and accessorial charges, so is a bit more volatile than the cleaner Cass Truckload Linehaul Index.
In 2022, the expenditures component of the Cass Freight Index rose 23%, after a record 38% increase in 2021, but is set to retrench in 2023.

Inferred Freight Rates
The rates embedded in the two components of the Cass Freight Index declined 2.4% y/y in January, after turning to a 0.4% decline in December.
- Cass Inferred Freight Rates were unchanged m/m and down 0.1% SA in January. Aside from some noise in this series as a result of fuel prices and modal mix, the trend has clearly turned lower over the course of 2022 and is poised to continue in this direction in the near term. This stability m/m is unusual.
- Freight rates are on track to fall 6%-7% y/y in the next few months based on the normal seasonal pattern of this index.
- In addition to market pressure on rates, the migration toward TL from LTL could press this index lower.
Along with sharp declines in ocean rates and many commodity prices, lower freight costs aid the outlook for significant disinflation needed to improve economic conditions.

Cass Inferred Freight Rates are a simple calculation of the Cass Freight Index data—expenditures divided by shipments—producing a data set that explains the overall movement in cost per shipment. The data set is diversified among all modes, with truckload (TL) representing more than half of the dollars, followed by less-than-truckload (LTL), rail, parcel, and so on.
Category: Driver Stuff, Equipment, Featured, Fleet Tracking, General Update, Management, News, Transit News, Vehicles


