
DAT Solutions Launches Freight Market Analytics Service
DAT Solutions has launched a new online analytics service for transportation and logistics professionals to access truck and load data on the 149 key market areas in North America with the highest concentrations of inbound and outbound freight.
Via an online portal, customers access a set of trucking freight data visualizations. Users also have the option of importing data into their own systems.
Customers can sort the data by individual and multiple key market areas to customize charts and maps of current or historical trends to help them understand demand and capacity. Market data comes from DAT Load Boards, which host more than 120 million load and truck posts each year, and DAT RateView, which compiles more than $24 billion in actual freight bills annually.
“For years, DAT Solutions has provided volumes of data on the 65,000 lanes we track,” said Greg Sikes, VP Products for DAT Solutions. “We developed this data analytics service through close collaboration with several top 50 third party logistics companies who are now benefitting from enhanced planning, carrier prospecting and benchmarking capability.”
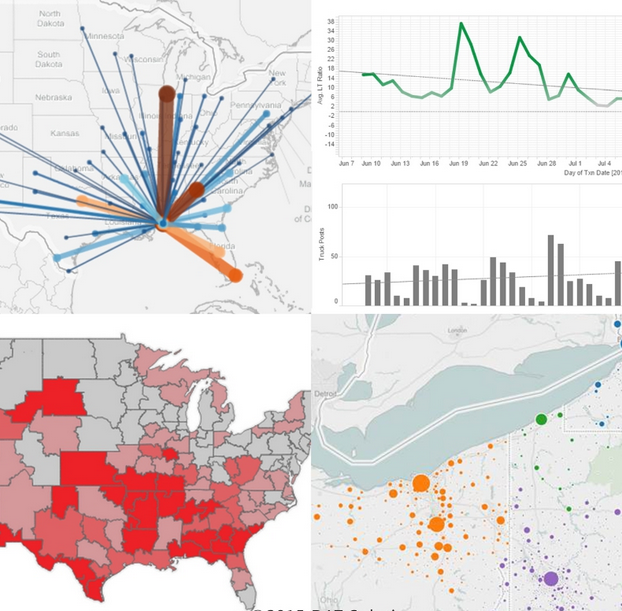
Currently available data visualizations include:
- Carrier development charts: Provides carrier load-search and truck-posting activity by company and key market area, so users can identify potential business partners in the lanes they run.
- Supply/demand heat maps: Shows the number of available freight loads vs. the number of available trucks in each key market area.
- Inbound/outbound trucks and loads map: Shows loads and trucks inbound and outbound for each key market area, to help users better understand freight volume patterns between cities.
- Truck density maps: Shows the concentration of trucks by equipment type within specific geographies.
Category: Featured, Fleet Diagnostics & Software, Fleet Tracking
Subscribe
If you enjoyed this article, subscribe to receive more just like it.