
DAT Trendlines: Spot truckload activity cools ahead of traditional summer peak
DAT Trendlines, week ending June 20, 2021
Spot truckload activity, already elevated, cools ahead of traditional summer peak
Spot truckload freight volumes fell 1.4% during the week ending June 20 as shippers work to loosen backlogged dry van, refrigerated and flatbed cargo, said DAT Freight & Analytics, which operates the industry’s largest network of load boards and the DAT iQ data analytics service. Capacity tightened as the total number of trucks posted to the DAT network declined 6.3% compared to the previous week.
National average spot truckload rates showed little movement up or down, however. Already elevated, spot pricing does not appear to be ramping up seasonally ahead of the July 4 holiday and back-to-school retail shopping.
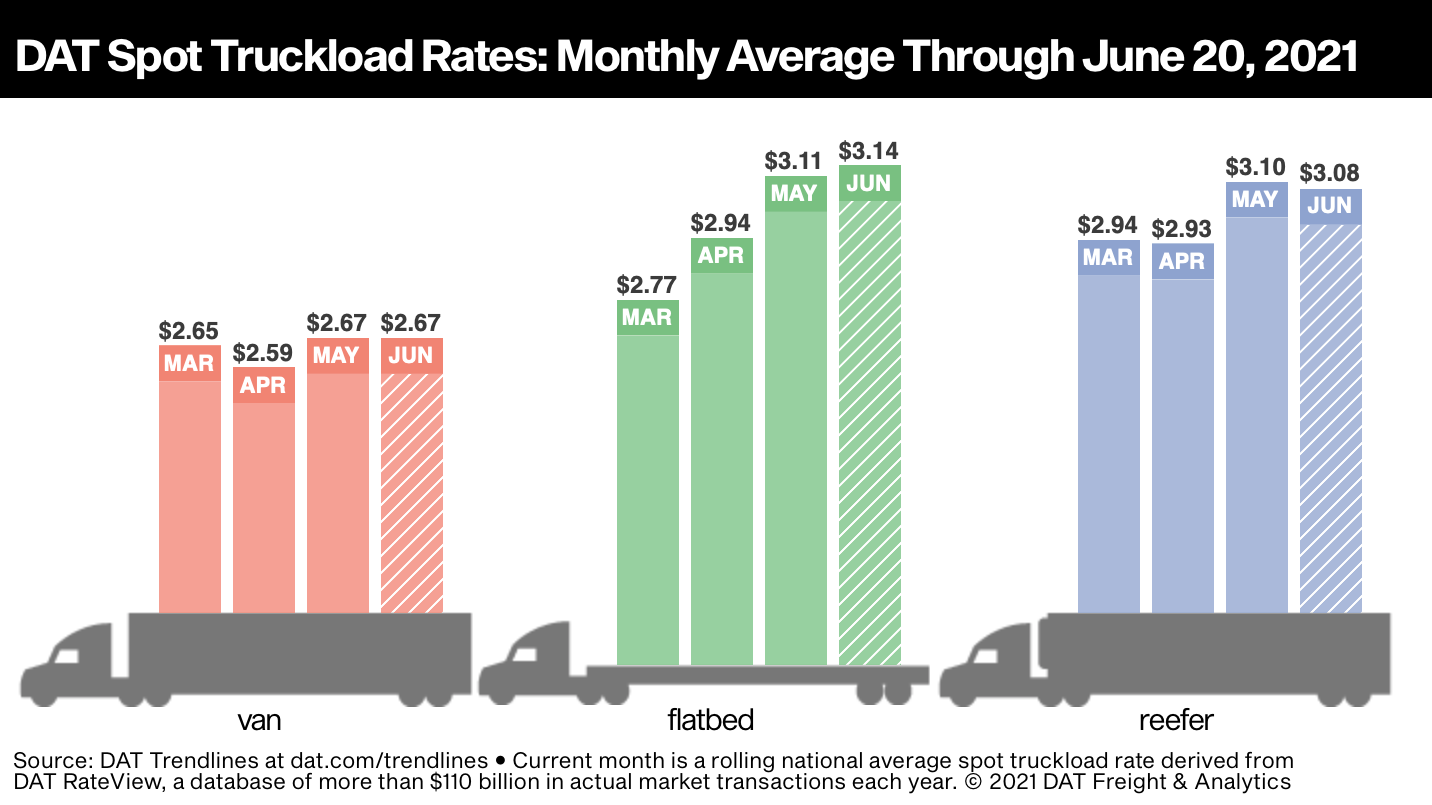
National Average Spot Rates, June
– Van: $2.67 per mile, unchanged from the May average
– Flatbed: $3.14 per mile, 3 cents higher than May
– Refrigerated: $3.08 per mile, down 2 cents compared to May
These are national average spot truckload rates for the month through June 20 and include a calculated fuel surcharge. The national average price of diesel was $3.29 a gallon last week, up 0.6% week over week.
Trendlines
Van load moves shift lower: In DAT’s top 100 van freight markets by volume, the number of loads moved fell 3.7% week over week and has been relatively stable since April except for an expected decline during Memorial Day week. Nationally, the van load-to-truck ratio increased from 4.5 to 5.2 as spot capacity stayed tight last week.
California van markets rise: Van freight is abundant in southern California as shippers work to loosen logistical obstacles. Los Angeles to Phoenix, a key lane for imported retail goods, averaged $4.52 a mile last week including a fuel surcharge, 13 cents higher than the week prior. At that rate, many carriers are quickly making their turn in Phoenix and coming back empty to Los Angeles, Ontario and other markets in California.
Flatbed load posts decline: Flatbed load post volume fell 10% compared to the previous week and is down 20% compared to May levels. The national average flatbed load-to-truck ratio dropped from 73.4 to 65.5 last week with very little change in the availability of equipment. The number of loads moved on DAT’s top 78 flatbed markets is down 5.9% since the last full week of May.
Reefers surge: Reefer freight volume on the DAT network was up 14% week over week as harvest activity increases and consumers stock up for summer. The national average reefer load-to-truck ratio increased from 9.2 to 11.3 although rates on high-volume lanes appeared to plateau.
Spot reefer demand is highly affected by produce distribution. The reefer lane from Atlanta to Miami averaged $3.67 a mile last week, up almost 30 cents over the last four weeks. This coincides with the end of produce season in southern Florida, when outbound rates and freight availability plummet. At the same time, California is now home to the country’s hottest reefer lanes including Ontario to Stockton ($4.26 per mile); Los Angeles to Stockton ($4.28); Fresno to Chicago ($3.51); and Los Angeles to Phoenix ($4.87). Spot freight volume from these markets are beginning to shift lower, however.
National average spot rates are derived from DAT RateView, a database of $110 billion in actual market transactions and 249 million freight matches each year. Get the latest spot pricing information at www.dat.com/trendlines or take a deeper dive with Market Insights at www.dat.com/blog. Also look for DAT across your social feeds on Facebook, Instagram, and Twitter, and join the DAT iQ team on YouTube or LinkedIn Live at 10 a.m. Eastern every Tuesday.
Category: Connected Fleet News, Driver Stuff, Featured, General Update, Management, News
Subscribe
If you enjoyed this article, subscribe to receive more just like it.