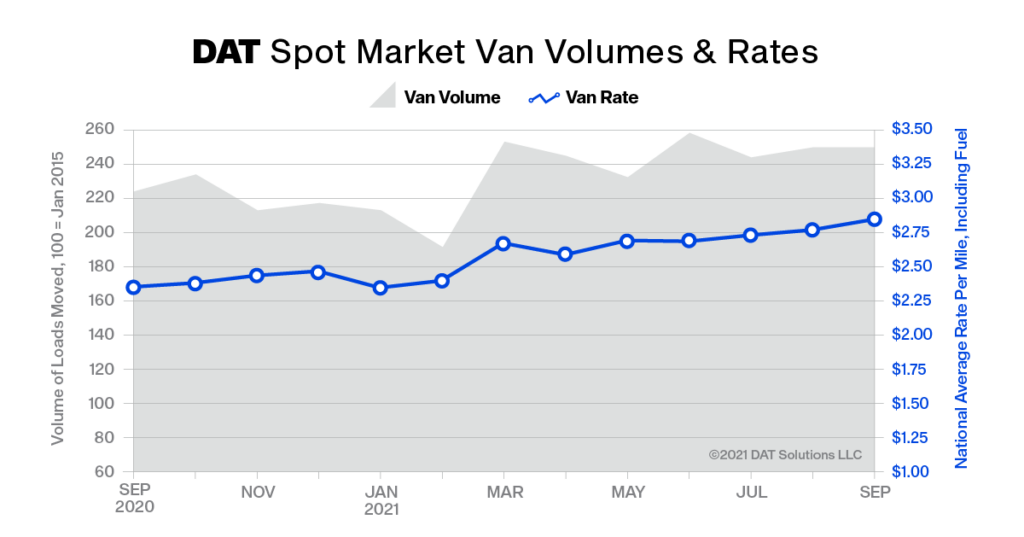
DAT Truckload Volume Index fell 1% in September; truckload rates spiked
Rates hit new highs in September as shippers grappled with historic surges of freight, constraints on equipment and drivers and an early start to the peak holiday shipping season
Spot and contract truckload rates hit new highs in September as shippers grappled with historic surges of freight, constraints on equipment and drivers and an early start to the peak holiday shipping season.
The DAT Truckload Volume Index was 229, down 1 percent compared to August and the highest for any September on record. The Index is an aggregated measure of dry van, refrigerated (“reefer”) and flatbed loads moved by truckload carriers each month. A decline of 7 to 10 percent is more typical from August to September.
“Businesses are shipping early and, where possible, by truck in order to make sure they have inventory, but this means using the spot market or higher-priced carriers to cover their loads,” said Ken Adamo, DAT Chief of Analytics. “If you’re accustomed to having the right truck in the right place at the right price, you can have one or two of those things but probably not all three.”
Spot van, reefer rates set records
The national average rate for van freight on the DAT One load board network increased 9 cents to $2.85 per mile (including a fuel surcharge), the fifth time the van rate has set a new monthly high this year. The rate averaged $2.37 a mile in September 2020.
At $3.25 per mile, the national average spot reefer rate was up 10 cents compared to August and was 68 cents higher year over year. The spot flatbed rate averaged $3.09 a mile, up 1 cent month over month. It was 68 cents higher versus September 2020.
Spot load postings fell 1.5%, capacity tightened
The number of loads posted to the DAT network fell 1.5 percent in September while truck posts decreased 4.5 percent. The national average van load-to-truck ratio was 6.3, meaning there were 6.3 loads for every van posted to the DAT network, down from 6.5 in August. The ratio was 5.4 in September 2020.
The reefer load-to-truck ratio dropped from 14.9 in August to 13.5, in line with seasonal declines in agricultural production. The flatbed ratio rose from 44.1 to 47.9, driven by single-family home construction, an increase in oil and gas activity and recovery efforts following Hurricane Ida.
Contract rates, fuel prices increased
The national average contract van rate was $2.85 per mile, up 3 cents compared to August and equal to the national average spot van rate. The contract reefer rate was $2.97 per mile, also up 3 cents month over month, while the average contract flatbed rate was unchanged at $3.30 per mile.
The national average price of on-highway diesel rose 3 cents to $3.38 a gallon, increasing for the sixth straight month. The spot and contract rates reported here include a fuel surcharge, which was 36 cents per mile for van freight last month. That’s 17 cents more than it was in September 2020.
Outlook
“The dog days of summer for freight did not materialize this year. Instead, the combination of strong consumer demand, new and evolving supply chain bottlenecks and early proactive shipping for the holiday season kept demand for capacity at record highs,” said DAT Chief Scientist Chris Caplice.
“We expect truckload pricing to remain elevated into Q1 2022 and for a market correction to occur in Q1 to Q2. This ‘correction’ will likely not be a ‘freight recession’ marked by consecutive quarters of decreased volumes and overcapacity, but a return to typical growth rates as shippers and carriers across all modes adjust to changes in consumer behavior, product distribution patterns and the effects of COVID-19 on the global economy.”
Category: Driver Stuff, Equipment, Featured, Fleet Tracking, General Update, Management, News


