Freight Volumes & Rates Edge Downward in Extended Soft Patch
Rates continue to decline as well in both the contract and spot markets
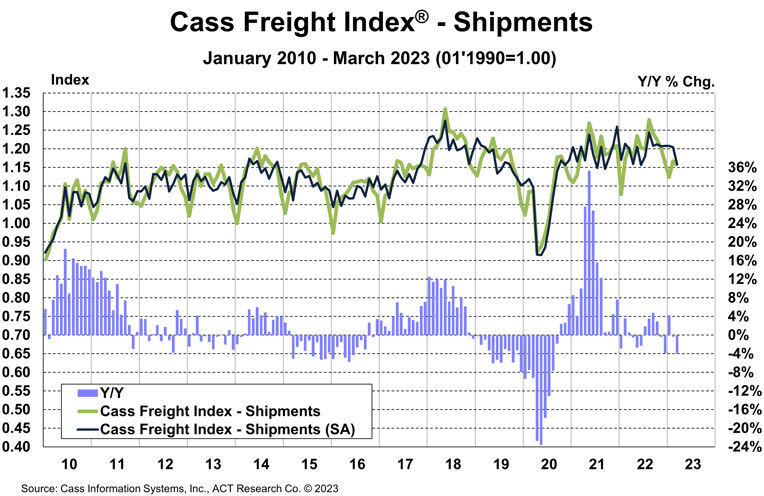
North American freight shipment volumes fell slightly in March (-1.0% m/m, -3.8% m/m seasonally adjusted) as freight markets continue to work through an extended soft patch. Year over year, volumes were down 4.0%.
Cass Freight Index – Shipments
The shipments component of the Cass Freight Index fell 1.0% m/m in March as freight markets continue to work through an extended soft patch.
- In seasonally adjusted (SA) terms, the index was 3.8% lower m/m in March, after inching lower by 0.3% in February.
- Mild weather this winter and Omicron a year ago both supported volume comparisons in January and February, so the lower result in March was not a surprise.
- On a y/y basis, the index turned to a 4.0% decline after a 0.3% y/y decline in February.

Soft real retail sales trends and ongoing destocking remain the primary headwinds to freight volumes, and sharp import declines suggest this type of environment will persist for some time. Normal seasonality from the March level suggests 1%-3% y/y declines for the next few months.
See the Methodology for the Cass Freight Index
Cass Freight Index – Expenditures
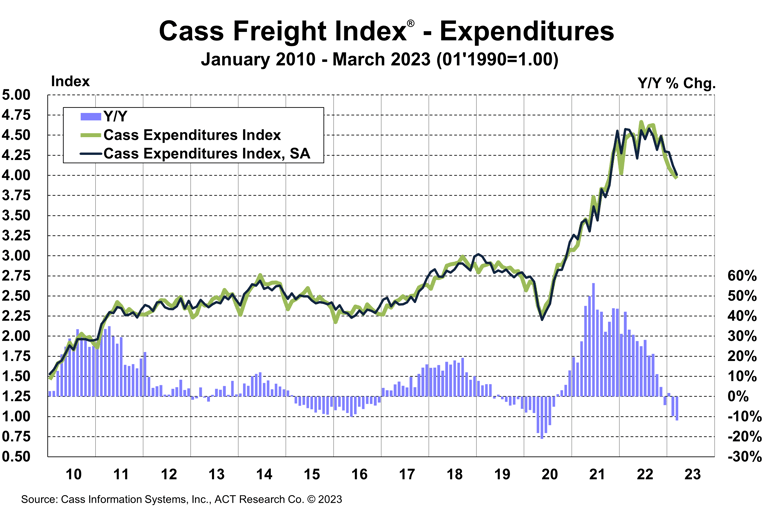
The expenditures component of the Cass Freight Index, which measures the total amount spent on freight, fell 1.5% m/m in March, and fell 12.0% y/y after a 9.7% y/y decline in February.
With shipments down 1.0% m/m in March, we infer rates were down 0.4% m/m (see our inferred rates data series below).
- On an SA basis, expenditures fell 2.8% m/m in March, with shipments down 3.8% and rates up 1.1%.
This index includes changes in fuel, modal mix, intramodal mix, and accessorial charges, so is a bit more volatile than the cleaner Cass Truckload Linehaul Index®.
The expenditures component of the Cass Freight Index rose 23% in 2022, after a record 38% increase in 2021, but is set to retrench in 2023.

Inferred Freight Rates
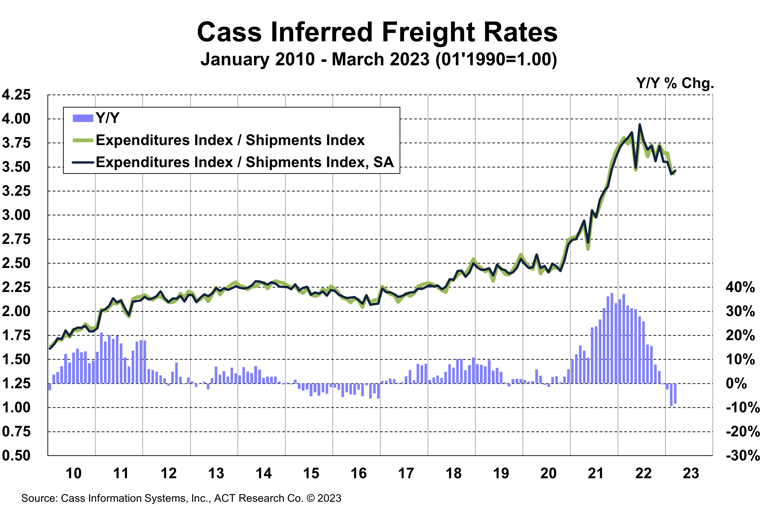
The rates embedded in the two components of the Cass Freight Index declined 8.3% y/y in March, after falling 9.4% in February.
- Cass Inferred Freight Rates were down 0.4% m/m after a 5.5% decline in February. Seasonally adjusted, inferred rates were up 1.1% m/m after a 3.6% m/m drop last month, partly due to higher less-than-truckload (LTL) shipment mix.
- Fuel prices are transitioning from an inflationary factor to a deflationary one as we pass the anniversary of the fuel price spikes that followed Russia’s invasion of Ukraine, and even allowing for modest increases to follow recent OPEC production cuts, we estimate lower fuel prices will knock about 5% off freight rates y/y starting mid-Q2.
- While fuel is a big factor, there’s clearly also still market pressure on rates.
- Based on the normal seasonal pattern of this index, freight rates should fall 9%-10% y/y in April.

Cass Inferred Freight Rates are a simple calculation of the Cass Freight Index data—expenditures divided by shipments—producing a data set that explains the overall movement in cost per shipment. The data set is diversified among all modes, with truckload (TL) representing more than half of the dollars, followed by less-than-truckload (LTL), rail, parcel, and so on.
Truckload Linehaul Index
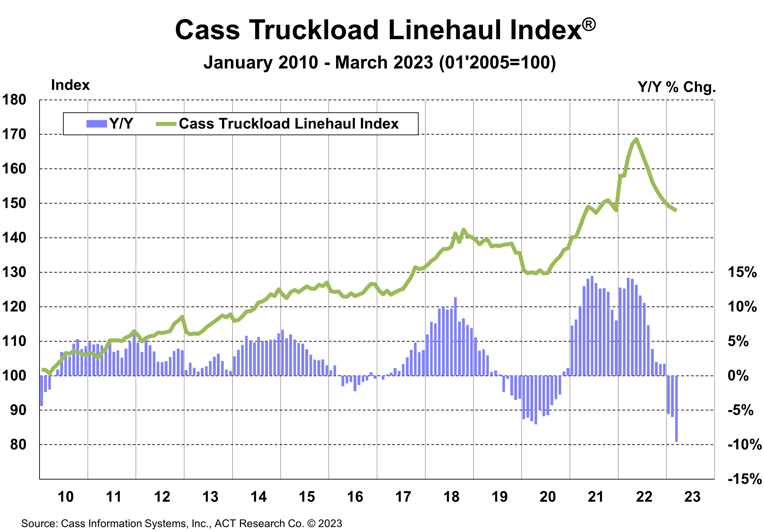
The Cass Truckload Linehaul Index fell 0.6% m/m in March to 147.7, after a 0.4% m/m decline in February.
- On a y/y basis, the Cass Truckload Linehaul Index fell 9.6% y/y in March after a 6.0% y/y decline in February.
- As a broad truckload market indicator, this index includes both spot and contract freight. With spot rates already down significantly, the larger contract market is likely to continue adjusting down, if more gradually, but in the same direction.

See the Methodology for the Cass Truckload Linehaul Index
Freight Expectations
Over the past year, the primary modal trend as capacity growth accelerated has been a considerable increase in the proportion of TL freight, and consequent declines in LTL and intermodal volumes.
TL and LTL are the two largest modes in the Cass database. The chart below illustrates the changes in mix between the two modes in y/y terms, ignoring the others for simplicity. Currently, TL represents considerably more of the data set than a year ago, and LTL is similarly below its year-ago level. Interestingly, and as we’d expect, in tight markets, freight flows from TL to LTL, and from LTL to TL in loose markets.
Critically, though it’s probably too early to call it a trend (the chart shows 3-month moving averages), the trend change so far this year suggests the trucking industry has passed peak looseness. Freight has been migrating to TL from other modes, but capacity growth has started to slow, and a rebalancing has begun.
Source: Cass Freight Index
Category: Equipment, Featured, Fleet Tracking, General Update, News, Transit News, Vehicles


