
New Capacity Bears Fruit for Shippers

The Cass Transportation Indexes accurately measure changes in North American freight activity. See Cass September report for the data
Freight demand remained strong in September (+5% over last year), buoyed by five temporary factors we explain in this month’s report. At the same time, we see rates softening, thanks to considerable buildup of supply over the last two years.
New Capacity Bears Fruit for Shippers
| September 2022 | Year-over-year change | 2-year stacked change | Month-to-month change | Month-to-month change (SA*) | |
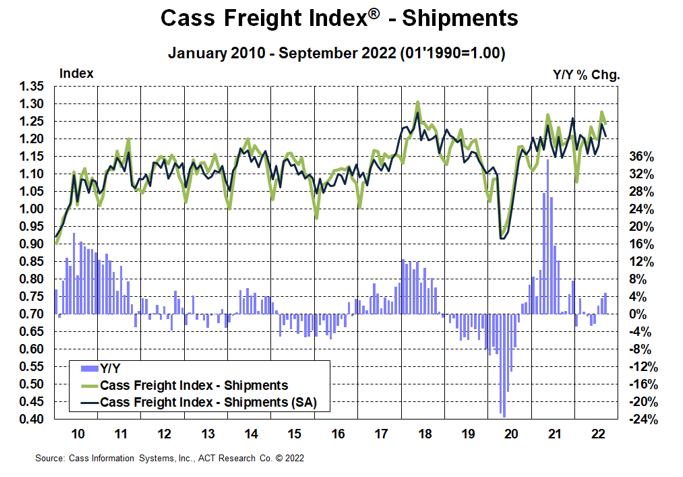
| Cass Freight Index – Shipments | 1.241 | 4.8% | 5.4% | -2.9% | -2.9% |
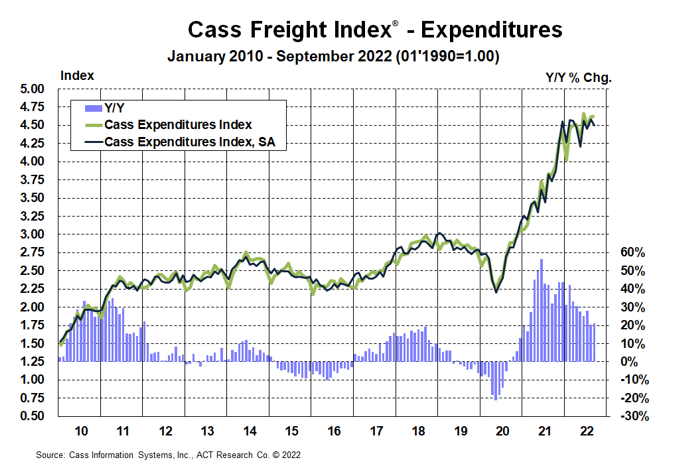
| Cass Freight Index – Expenditures | 4.627 | 21.2% | 60.2% | 0.3% | -1.9% |
| Cass Inferred Freight Rates | 3.728 | 15.6% | NA | 3.3% | 1.0% |
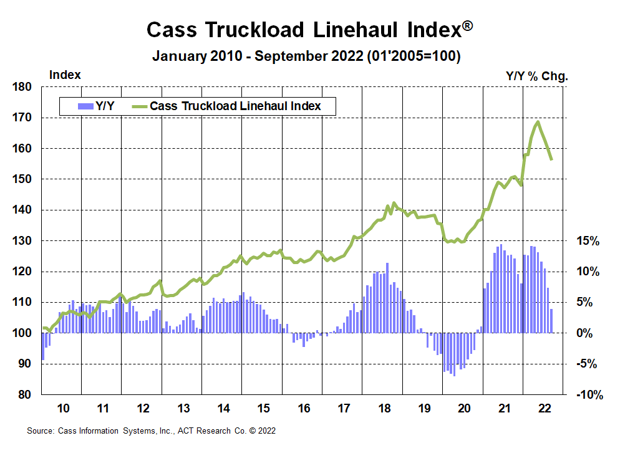
| Truckload Linehaul Index | 156.24 | 3.9% | 17.1% | -2.2% | — |
* SA = seasonally adjusted
Cass Freight Index – Shipments
The U.S. freight volumes continued to exceed low expectations in September with more buoyant demand than feared in the start of peak shipping season.
- The shipments component of the Cass Freight Index® fell 2.9% m/m in September (-2.9% SA), reversing much of the 5.5% rise in August.
- On a y/y basis the index was up 4.8%, accelerated from 3.6% in August, with the acceleration more than explained by an easier comparison.
- After a soft 1H’22 as freight demand has been buffeted by both inflation and the substitution from goods back to services, the considerable improvement in the past two months likely reflects a combination of several temporary factors:
- retail discounting to clear excess inventory in some categories,
- seasonal inventory building ahead of the holidays,
- repositioning mis-timed inventory
- easing supply constraints, particularly in auto production,
- easier prior-year comparisons.
Normal seasonality from here would have shipments slowing to 2%-3% y/y growth in October on a tougher comp, down slightly y/y in Q4 and about flat for the year. Tougher comps in November and December also suggest the recent increases are temporary.
See the methodology for the Cass Freight Index.
Cass Freight Index – Expenditures
The expenditures component of the Cass Freight Index, which measures the total amount spent on freight, rose 0.3% m/m in September after a 1.9% m/m increase in August. Against a shipment decrease of 2.9% m/m in September, we can infer that rates overall were up 3.3% (see our inferred rates data series below). The increase in rates m/m appears mainly due to mix changes and seasonality.
- The expenditures index was still 21% higher than year-ago levels in September, accelerating slightly from 20% in August.
- On an SA basis, expenditures fell 1.9% m/m in September, with shipments down 2.9% m/m and rates up 1.0%.
This index includes changes in fuel, modal mix, intramodal mix, and accessorial charges.
Simply following normal seasonality from here, this index is on track for a 23% increase in 2022 and would turn down on a y/y basis next February.
Inferred Freight Rates
The freight rates embedded in the two components of the Cass Freight Index rose 16% y/y in September, decelerating by <1% from the 16% y/y increase in August.
- Cass Inferred Freight Rates rose 3.3% m/m (1.1% SA) in September. Fuel prices were up slightly, but the m/m increase was mainly due to seasonality and modal mix. With looser truckload market conditions, further deceleration remains all but assured.
While comparisons suggest double-digit increases will persist in October, this series should slow to mid-single-digit growth rates by year end and declines by early next year.
The supply/demand balance in U.S. trucking markets has loosened significantly this year, and as a result freight rates are leveling off and set to slow sharply in the months to come.
While shippers aren’t seeing any real savings yet, considerable cost relief is now highly probable for 2023, which we think will be welcome news for the broader inflation picture.
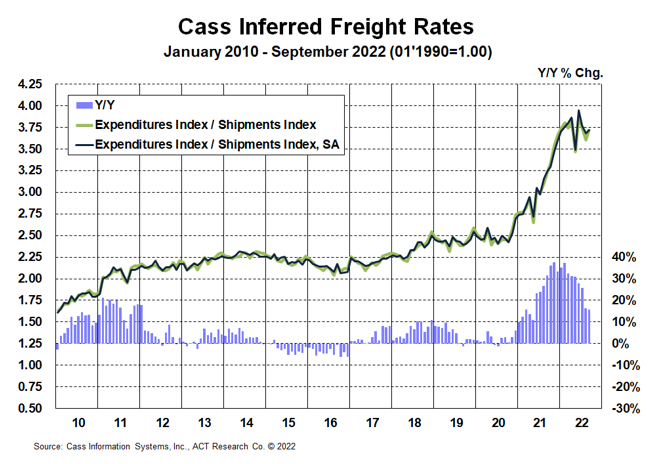
Cass Inferred Freight Rates™ are a simple calculation of the Cass Freight Index data—expenditures divided by shipments—producing a data set that explains the overall movement in cost per shipment. The data set is diversified among all modes, with truckload representing more than half of the dollars, followed by LTL, rail, parcel, and so on.
Truckload Linehaul Index
The Cass Truckload Linehaul Index®, which measures changes in truckload linehaul rates, slowed to a 3.9% y/y increase in September after rising 7.4% y/y in August.
- On a m/m basis, the Cass Truckload Linehaul Index fell 2.2%, larger than the 1.8% m/m declines of the past three months.
- As a broad market indicator, this index includes both spot and contract freight, and with spot rates already down significantly, it’s only a matter of time until the index begins to decline on a y/y basis (projected for January ’23 in the ACT Freight Forecast).
- Similar to what has occurred in the spot market, the recent resurgence of fuel costs, which are excluded from this index, will also likely act as a brake on linehaul rates.
See the methodology for the Cass Truckload Linehaul Index.
Freight Expectations
It sure doesn’t feel like freight volumes were up nearly 5% y/y in September, does it? Our analysis suggests this will not repeat for quite some time, and it took the right combination of easy comps and temporary factors to make happen. So, though we know it will raise questions, we don’t think the y/y comp is too meaningful here. The Cass data line up with ACT’s recent industry conversations finding resilience, though there is little real questioning of the consensus that the freight economy is in a soft patch that could be with us for a while.
How can this recent demand strength be compatible with consistent and significant downtrends in ocean container and truckload spot rates? In a word, supply. In our view, it’s the cumulative massive effort of ramping up supply chain capacity over the past two years, amid varying stages of crisis, which is now bearing fruit.
While demand is still looking about flat this year, the supply side recovery has turned the market from tight to loose. Thus, the reason market dynamics are much different this year it is not that there is less freight. It’s more capacity.
For example, dry van and flatbed spot rates jumped for a few days after Hurricane Ian. The storm is likely to lead to considerable reconstruction-related freight next year, but rates gave up the brief increase and have fallen since in a sign of ongoing loose capacity. In a tighter market, we think the effect on rates would have been much greater.
In our view, though the demand softness will be limited by the strong financial position of the U.S. consumer, the factors behind the past two months of strong volume data are likely to fade from here.
The story concludes in ACT Research’s monthly Freight Forecast. Now that the pendulum is swinging, some crucial questions about the freight rate cycle have been raised: How long? And when will it turn? The ACT Research Freight Forecast report provides monthly, quarterly, and annual predictions for the truckload (TL), less-than-truckload (LTL), and intermodal markets through 2024, including capacity, volumes, and rates. The report provides monthly updates of forecasts for the shipments component of the Cass Freight Index and the Cass Truckload Linehaul Index, as well as DAT spot rates by trailer type, including and excluding fuel surcharges.
Release date: We strive to release our indexes on the 12th of each month. When this falls on a Friday or weekend, our goal is to publish on the next business day.
Byline: Cass Transportation Index
Category: Equipment, Featured, General Update, Management, News, Transit News, Vehicles
Subscribe
If you enjoyed this article, subscribe to receive more just like it.