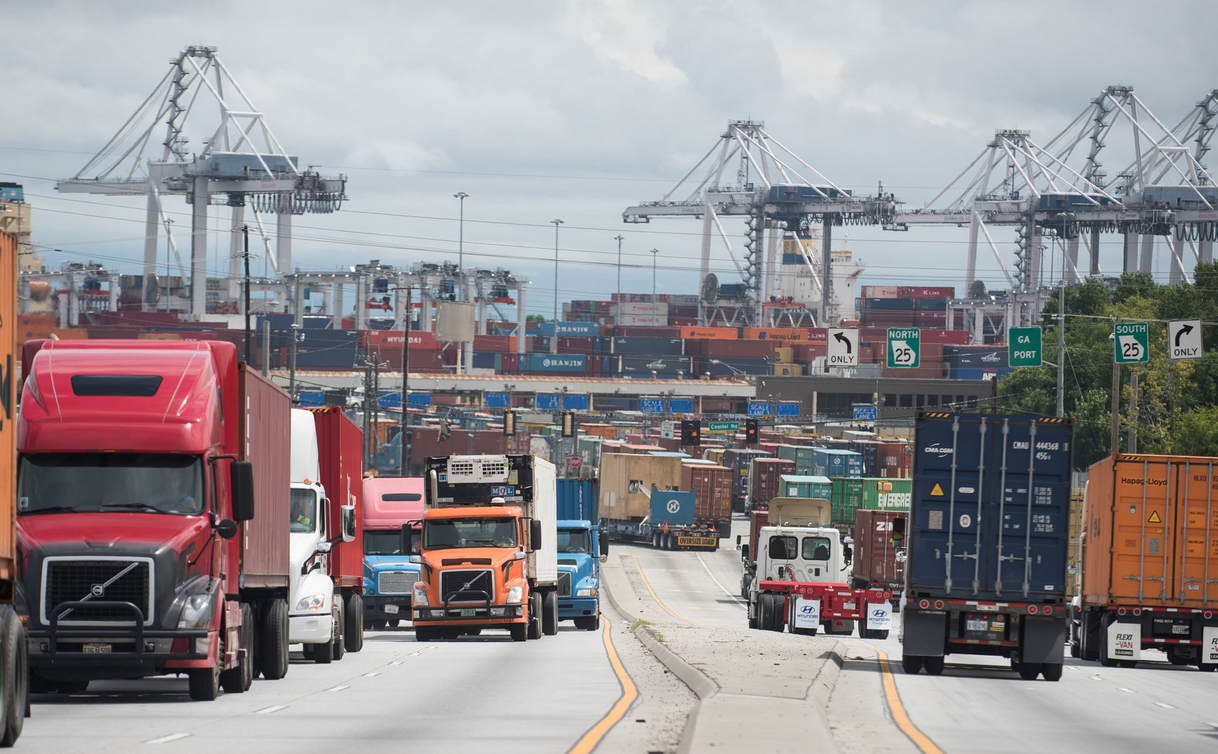
Report Shows Shipment Volumes and Pricing Soften
July’s Cass Freight Index confirmed that overall shipment volumes (and pricing) are persistently weak, with increased levels of volatility as all levels of the supply chain (manufacturing, wholesale, retail) continue to try and work down inventory levels.
That said, there have been a few areas of growth, mostly related to e-commerce, with lower levels of expansion being experienced in transit modes serving the auto and housing/ construction industries.
All of this added up to slightly lower shipment volume in July, the seventeenth straight month of year-over-year decline.
Here’s what the Cass report finds. The U.S. economy continues to be in a state of transition. One of the big changes is that U.S. consumers have been choosing to pay down debt and increase their savings rate. Simply put, the consumer has not yet picked up where the industrial economy left off.
Inventories have now contracted from GDP for five consecutive quarters to the tune of ~3% of GDP. This is the longest stretch outside of a recession since 1956-57 and the largest in magnitude since 1995. We expect de-stocking to continue into Q3 in retail, based on the NRF’s (National Retail Federation’s) Port Tracker survey.
Noted Cass: “We remain concerned about elevated levels of cars on dealer lots, and we acknowledge continued efforts to streamline finished inventory in most machinery sectors. Overall inventory levels remain elevated compared to sales, but with further improvement on many ratios in ‘2H (which we expect), and unless demand takes another step down, we believe the persistent drag of de-stocking should progressively lessen as we enter 2017.”
What specifically drove July’s decline in volume? The Association of American Railroads (AAR) reported that July YOY (year-over-year) overall traffic for U.S. Class 1 railroads declined 6.1%, as intermodal units fell 5.4% and commodity carloads originated fell 6.9%. Rails have seen persistent weakness, with overall volumes being negative 77 out of the last 78 weeks.
Cass continued: “We continue to assert the trucking industry provides one of the more reliable reads on the pulse of the domestic economy, as it gives us clues about the health of both the manufacturing and retail sectors. We should note that as the first industrial-led recovery (2009-2014) since 1961 came to an end, and the shift from ‘brick and mortar’ retailing to e-commerce/omni-channel continues, we are becoming more focused on the number of loads moved by truck and less focused on the number of tons moved by truck.
Tonnage itself appears to be growing (three-month moving average +2.75% not seasonally adjusted, +3.24% seasonally adjusted). Counter to this, truck loads have contracted on a YoY basis three out of six months in 2016, with June posting the worst comp since December 2012 (-4.4%). No matter how it is measured, the data coming out of the trucking industry has been both volatile and uninspiring.
The bottom line: truck volumes are mixed, as tonnage continues to be slightly positive and load volume continues to be slightly negative.
Freight payments declined 5.1% in July on a YoY basis. This ongoing weakness, also in its seventeenth straight month of decline, is being driven by a number of factors. In part, this weakness is driven by the excess of capacity in most modes: trucking, rail, air freight, barge, ocean container and bulk. The weakness is also driven in part by the ongoing decline in diesel and jet fuel and corresponding fuel surcharges that influence pricing realized by shippers.
Category: Featured


