Spot truckload freight volume increased 4.5% as June comes to a close
DAT Trendlines, week ending June 27, 2021
Spot truckload freight volumes increased 4.5% as June comes to a close
Spot truckload freight volumes increased 4.5% last week, said DAT Freight & Analytics, which operates the industry’s largest network of load boards and the DAT iQ data analytics service. Capacity tightened as the total number of trucks posted to the DAT network declined 4.7% compared to the previous week.
National average spot van, refrigerated and flatbed pricing changed marginally compared to the previous week. The typical bounce ahead of the close of the second quarter and July 4 holiday did not occur, although the average van rate is nearly 67 cents a mile higher year over year and the reefer and flatbed rates are 78 cents a mile higher.
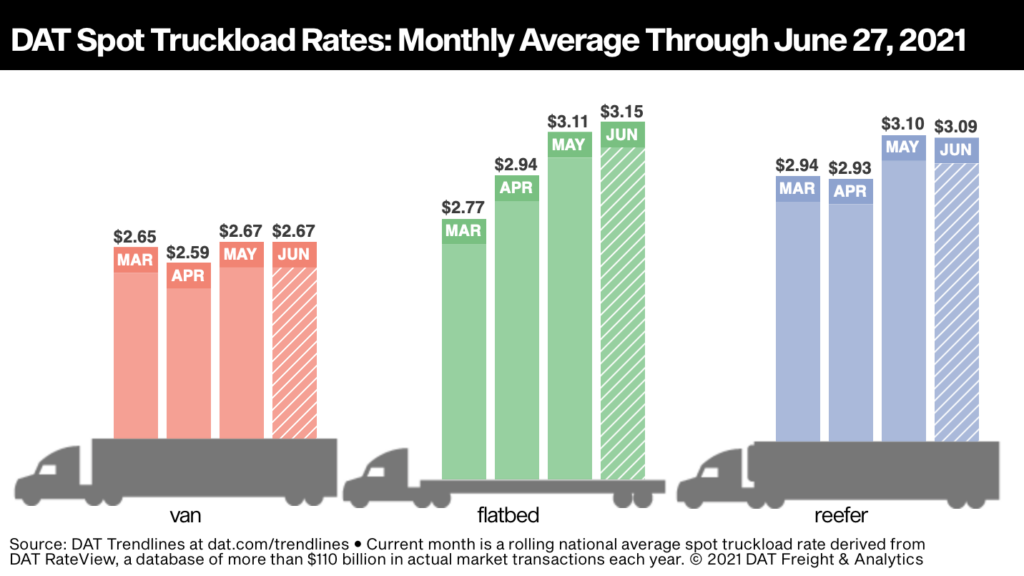
National Average Spot Rates, June
- Van: $2.67 per mile, unchanged from the May average
- Flatbed: $3.15 per mile, 4 cents higher than May
- Refrigerated: $3.09 per mile, down 1 cent compared to May
These are national average spot truckload rates for the month through June 27 and include a calculated fuel surcharge. The national average price of diesel was $3.30 per gallon last week, up 0.3% week over week.
Trendlines
Seasonality returned to the market last week as retailers and food distributors pushed to move freight ahead of July 4 celebrations. Shippers typically preposition freight around the country during the last two weeks leading up to the holiday and use the spot market to move urgent or “exception” freight, as indicated in the 4.5% increase in load posts.
Dry van load-post volume was up 17% last week and the national average van load-to-truck ratio was 6.4, up from 5.2 the previous week. The load-to-truck ratio is a measure the number of available loads on the DAT network relative to the number of available trucks and is a simple indicator of capacity supply and demand.
Reefer load post volume increased 20% week over week and the national average reefer load-to-truck ratio was 14.2, up from 11.1 the previous week. Overall, the number of truckloads of produce moved is down about 20% year over year, or 8,200 fewer loads of produce per week in 2021, according to the U.S. Dept. of Agriculture.
Flatbed load post volume was 8% lower last week and are down 24% over the last month. Indeed, flatbed volume has been softening for the last nine weeks. The national average flatbed load-to-truck ratio fell 8% from 65.5 to 60.6.
Lanes to watch:
- Spot van: Los Angeles to Phoenix van rates averaged $4.44 per mile excluding a fuel surcharge. The 372-mile run is up 12 cents per mile week over week and $1.42 per mile since February. Phoenix is a fast-growing market for large warehouses.
- Spot van: Vans from Atlanta to Orlando averaged $3.89 per mile excluding fuel, a record for the 440-mile lane. The average spot van rate is now up $1.08 per mile since February.
- Spot flatbed: Houston to Lubbock, Texas, in the Permian Basin is the highest-volume lane for spot-market flatbed loads moved each year. The average rate was $3.73 per mile, up $2.04 year over year. The Baker Hughes drilling rig count in Texas stands at 221, more than double this time last year. Volume on this lane is driven by drill pipe, casings and related products being hauled west.
- Spot reefer: Loads from Laredo, Texas, to Atlanta averaged $3.07 a mile this week and have been climbing steadily since May 2020 when they were just $1.91 a mile. That’s a 60% increase year over year.
National average spot rates are derived from DAT RateView, a database of $110 billion in actual market transactions and 249 million freight matches each year. Get the latest spot pricing information at www.dat.com/trendlines or take a deeper dive with Market Insights at www.dat.com/blog. Also look for DAT across your social feeds on Facebook, Instagram, and Twitter, and join the DAT iQ team on YouTube or LinkedIn Live at 10 a.m. Eastern every Tuesday.
Category: Connected Fleet News, Driver Stuff, Equipment, Featured, Fleet Tracking, General Update, Management, News


