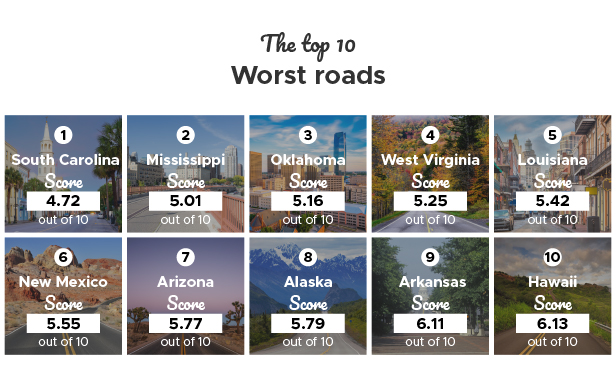
These states have the WORST roads in America
Part of Biden’s $2 trillion plan is to improve the roads in America – but just how bad is the current situation and which states have the worst roads?
New research from Zutobi reveals the states with the worst – and best – roads in America by looking at the quality of roads in each state according to the International Roughness Index and the rate of highway deaths in 2020 to calculate an overall score /10.
See the results here: https://zutobi.com/us/driver-guides/the-worst-roads-in-the-us
South Carolina has the worst roads in America:
| Rank | State | Score |
| 1 | South Carolina | 4.72 |
| 2 | Mississippi | 5.01 |
| 3 | Oklahoma | 5.16 |
| 4 | West Virginia | 5.25 |
| 5 | Louisiana | 5.42 |
| 6 | New Mexico | 5.55 |
| 7 | Arizona | 5.77 |
| 8 | Alaska | 5.79 |
| 9 | Arkansas | 6.11 |
| 10 | Hawaii | 6.13 |
- South Carolina scored the worst of all the states with a reasonable 81.3% of acceptable road surface, but 183 highway fatalities per 1 million vehicle miles traveled – the highest of any state.
- Mississippi has the second worst roads in America with just 73.2% of its roads deemed acceptable and 163 highway fatalities per 1 million vehicle miles traveled.
Minnesota has the best roads in America:
| Rank | State | Score |
| 1 | Minnesota | 9.10 |
| 2 | Massachusetts | 8.66 |
| 3 | Maryland | 8.51 |
| 4 | Iowa | 8.22 |
| 5 | Utah | 8.13 |
| 6 | New York | 8.12 |
| 7 | Virginia | 8.11 |
| 8 | Wisconsin | 8.10 |
| 9 | Indiana | 8.00 |
| 10 | North Dakota | 7.98 |
- Minnesota has the best roads in America thanks to 85.1% of acceptable miles of public road and just 61 highway fatalities per 1 million vehicle miles traveled.
- While Massachusetts ranks second, it only scores 70.1% in the amount of acceptable miles of public road, but the lowest fatality rate of all states at 54 highway fatalities per 1 million vehicle miles traveled.
You can see the research here.
Category: Driver Stuff, Featured, Fleet Maintenance, General Update, News, Safety, Transit News


