
Truckload linehaul rates have fallen an average of -1.1% a month for the past 12 months

Cass Transportation Index reports while the broader economy shows surprising strength, the freight economy continued to tell a different story in July
Lower for Longer?
| July 2023 | Year-over-year change | 2-year stacked change | Month-to-month change | Month-to-month change (SA*) | |
| Cass Freight Index – Shipments | 1.122 | -8.9% | -4.7% | -2.2% | -1.2% |
| Cass Freight Index – Expenditures | 3.423 | -24.4% | -2.5% | -2.8% | -2.0% |
| Cass Inferred Freight Rates | 3.051 | -17.0% | NA | -0.6% | -0.8% |
| Truckload Linehaul Index | 142.0 | -12.7% | -3.5% | -0.2% | — |
* SA = seasonally adjusted
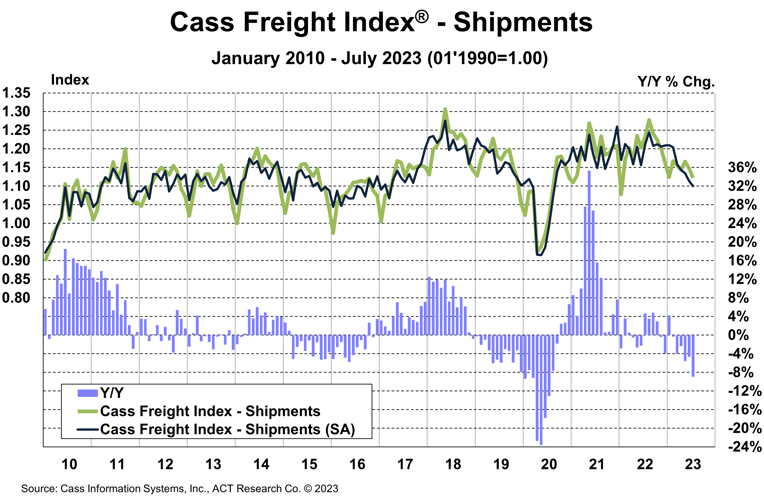
Cass Freight Index – Shipments
The shipments component of the Cass Freight Index® fell 2.2% m/m in July and fell 1.2% m/m in SA terms.
- July volumes were on par with January in absolute terms, despite 10% stronger seasonality.
- On a y/y basis, the index was 8.9% lower in July, after a 4.7% decline in June.
- The freight market downcycle is now 19 months old, which compares to a range of 21 to 28 months in the past three downcycles.
- Declining real retail sales and destocking remain the primary issues, but dynamics are shifting as real incomes improve and the worst of the destock is in the rearview.
In seasonally adjusted (SA) terms, the index is now 13% below the December 2021 cycle peak, slightly greater than the peak-to-trough declines in two of the three downcycles in the past dozen years.
With normal seasonality, this index would increase slightly m/m in August but decline about 11% y/y, comparing to the extraordinary time last summer when destocking was actually creating freight demand as retailers were shipping out stale inventory. Even adjusting for the strange comparison, this will probably overstate the pressure on national freight volumes because the for-hire market is losing share to private fleets, as discussed below.
See the Methodology for the Cass Freight Index
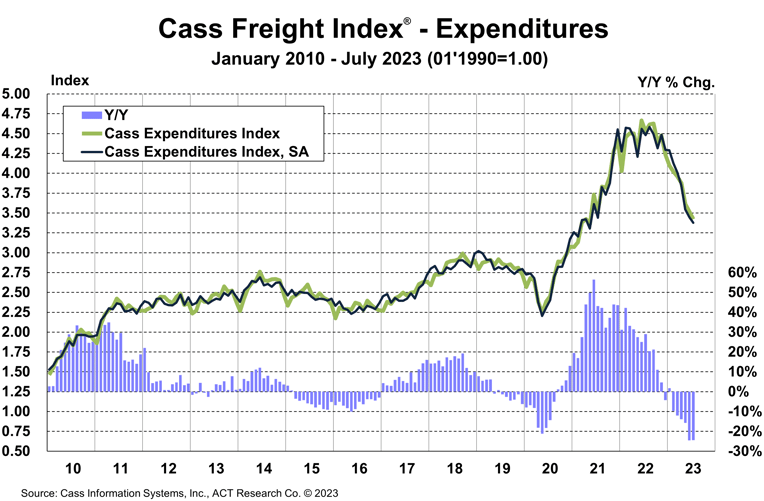
Cass Freight Index – Expenditures
The expenditures component of the Cass Freight Index, which measures the total amount spent on freight, fell 2.8% m/m and 24.4% y/y in July.
With shipments down 2.2% m/m in July, we infer rates were down 0.6% m/m (see our inferred rates data series below).
- On an SA basis, the index declined 2.0% m/m, with shipments down 1.2% and rates down 0.8%.
This index includes changes in fuel, modal mix, intramodal mix, and accessorial charges, so is a bit more volatile than the cleaner Cass Truckload Linehaul Index®.
The expenditures component of the Cass Freight Index rose 23% in 2022, after a record 38% increase in 2021, but is set to decline about 18% in 2023, assuming normal seasonal patterns from here. Both freight volume and rates remain under pressure at this point in the cycle, but fuel price increases could limit the savings for shippers.
Inferred Freight Rates
The rates embedded in the two components of the Cass Freight Index declined 17% y/y in July, after falling 21% in June.
- Cass Inferred Freight Rates decreased 0.8% m/m SA after a 0.9% decline in June, as contract rates continued to reset lower.
- Based on the normal seasonal pattern, this index would decline slightly m/m in August, and the y/y decline would remain about 17%.
- We estimate lower fuel prices are knocking about 5% off freight rates y/y, and while fuel is a big factor, there’s clearly also still market pressure on rates.
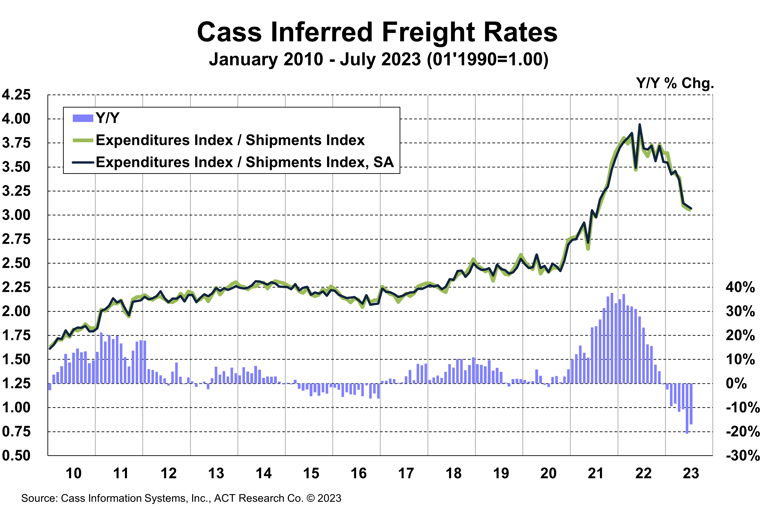
Cass Inferred Freight Rates are a simple calculation of the Cass Freight Index data—expenditures divided by shipments—producing a data set that explains the overall movement in cost per shipment. The data set is diversified among all modes, with truckload (TL) representing more than half of the dollars, followed by less-than-truckload (LTL), rail, parcel, and so on.
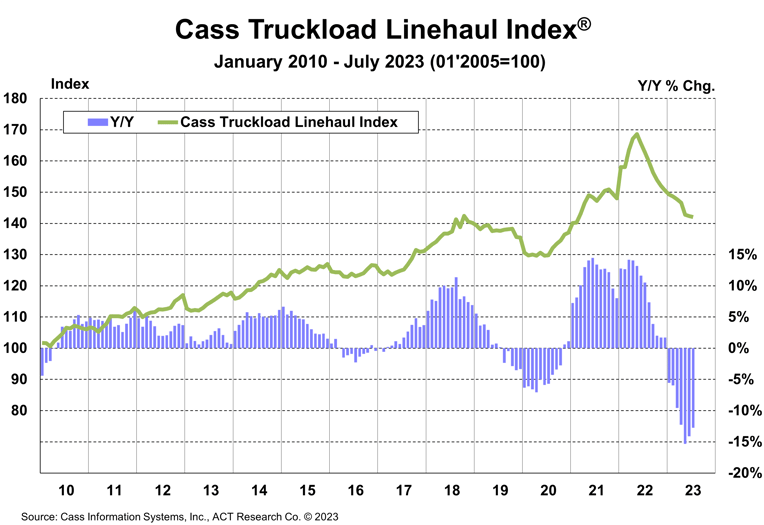
Truckload Linehaul Index
The Cass Truckload Linehaul Index, which—as its name implies—measures changes in linehaul rates only, fell 0.2% m/m in July to 142.0, after a 0.4% m/m decline in June.
- The slower decline in the past two months likely reflects a combination of slightly higher spot rates and smaller declines in contract rates.
- On a y/y basis, the Cass Truckload Linehaul Index fell 12.7% y/y in July, after a 14.1% y/y decline in June.
- As a broad truckload market indicator, this index includes both spot and contract freight. With spot rates already down significantly, the larger contract market.
See the Methodology for the Cass Truckload Linehaul Index
Freight Expectations
We’ve been citing the key factors behind the freight downturn—substitution and inventory—for well over a year, but it’s not all macro factors.
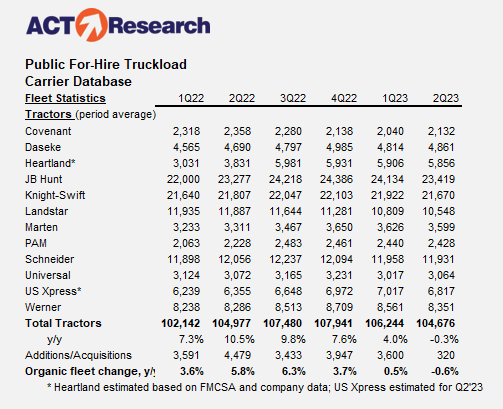
One key and likely underappreciated industry-specific factor is the rapid growth of private fleets. The publicly traded for-hire truckload fleets reduced their collective tractor count by 3% in 1H’23 (see table) and operating authority revocations remain elevated, so for-hire capacity is contracting quickly. But Class 8 tractor production is still at maximum levels, growing the overall fleet, and consequently keeping downward pressure on spot rates.
Private fleets represent over half of Class 8 tractor capacity, and we believe their growth is pulling freight out of the for-hire market, prolonging the industry downturn.
Though significant progress has been made in rebalancing, we think it’s unlikely that industry capacity will broadly tighten until pressure from private fleet growth eases, which looks unlikely this year. Though the freight market is still near the bottom of the cycle, the first step in getting out of a hole is to stop digging. New truck orders in the next few months will be very interesting and, in our view, will be pivotal to setting the market tone for 2024.
The capacity contraction in the for-hire sector is coiling the proverbial spring for better market conditions, but this outlook could be spoiled if the private fleet segment continues its massive fleet expansion.
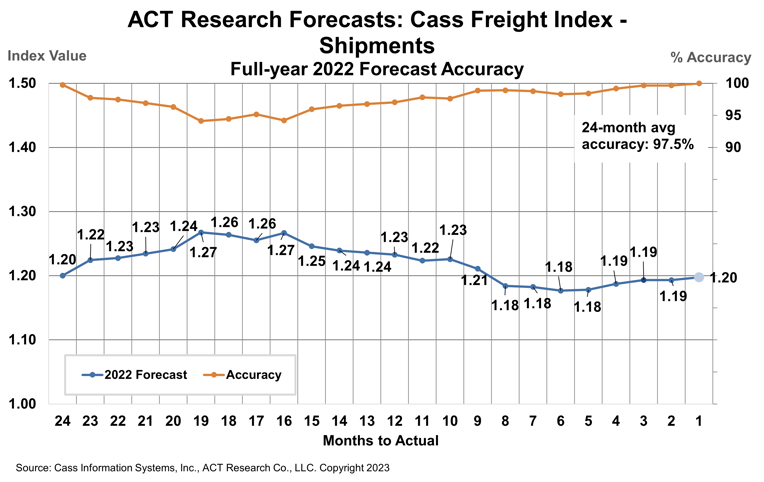
If you need to understand the future direction of freight markets, the ACT Research Freight Forecast provides in-depth analysis and forecasts for a broad range of U.S. freight measures, including the Cass Freight Index, Cass Truckload Linehaul Index, and DAT spot and contract rates by trailer type, LTL and intermodal price indexes. This service provides monthly, quarterly, and annual predictions for the TL, LTL, and intermodal markets over a two- to three-year time horizon, including capacity, volumes, and rates. The Freight Forecast is released monthly in conjunction with this report.
How have their forecasts performed? For 2022, ACT’s forecasts for the shipments component of the Cass Freight Index were 97.5% accurate on average for the 24-month forecast period. Our January 2021 forecast, two full years out, was 99.8% accurate.
(As a reminder, ACT Research’s Tim Denoyer writes this report.)
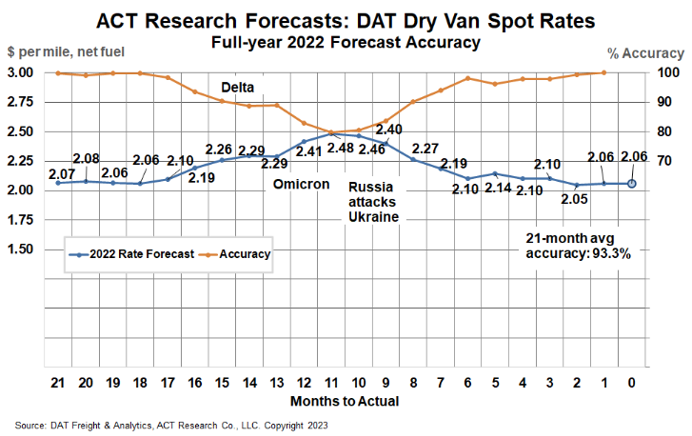
ACT Research’s full-year 2022 DAT spot rate forecasts were 99.7% accurate from Q2’21 (19-21 months out) for dry van and 98.5% for reefer. DAT dry van spot rates, net fuel, finished 2022 at $2.06 per mile, in line with our forecasts to the penny from 18 and 19 months out (June and July 2021).
Source: Cass Transportation Index
Category: Driver Stuff, Equipment, Featured, General Update, Management, News, Transit News, Vehicles
Subscribe
If you enjoyed this article, subscribe to receive more just like it.