4 Ways Reopening Has Changed US Commercial Transportation
Samsara Data Insights
In a race to stop the spread of COVID-19, millions of Americans across the country were ordered to stay home, except for essential activities. While all states have reopened in some capacity, the date they went into lockdown and the time they spent under that lockdown varies dramatically.
To see how these varying restrictions impacted commercial transportation in the United States, Samsara leveraged data from the nearly 130 million trips our 15,000 customers—operating across diverse industries including transportation and logistics, food production, local government, and more—have taken since the start of 2020. We analyzed transportation trends and safety incidents before, during, and after lockdowns across the United States.* Read on to learn our biggest discoveries, including changes to commercial activity, industry-specific trends, and shifts in driver behavior.
Key findings
- On average, U.S. states have returned to above 95% of pre-COVID-19 commercial driving activity, both in terms of miles driven and vehicles on the road. States that had limited or no shelter-in-place orders are now seeing a 7% average increase in miles driven and vehicles on the road.
- Despite this, some industries—like passenger transit and education—have experienced a more significant impact while others, like long haul transportation, have recovered quickly.
- There has been a decline in certain unsafe driving behaviors, like harsh braking and acceleration, but emptier roads have also resulted in a 20% increase in severe speeding, with the trend even more pronounced in urban settings.
1. Commercial driving activity has returned to normal, or higher than normal, levels
On average, U.S. states have returned to be within 95% of pre-COVID-19 commercial driving activity—which we’ve defined as miles driven and the number of operating vehicles on the road. But this is not without some variation.
States that experienced limited to no lockdown restrictions are seeing a faster return to average commercial driving activity pre-pandemic. Not only have these states already seen a return to more than 100% of pre-COVID-19 commercial driving activity, but they also saw more modest declines during shutdown periods. In the week immediately following Memorial Day, commercial driving activity in these states increased by 7% from pre-COVID-19 baseline levels. While this may partly be due to lost activity during the holiday week, overall miles driven and vehicle activity trends continue to show increases above the pre-COVID-19 baseline.
States with prolonged shutdowns are starting to reach the same level of miles driven as states with only moderate shutdowns. This is despite sharper declines in miles driven during peak periods of COVID-19. Taken together, this may demonstrate all states are starting to return to pre-COVID-19 commercial driving activity, regardless of shutdown severity.

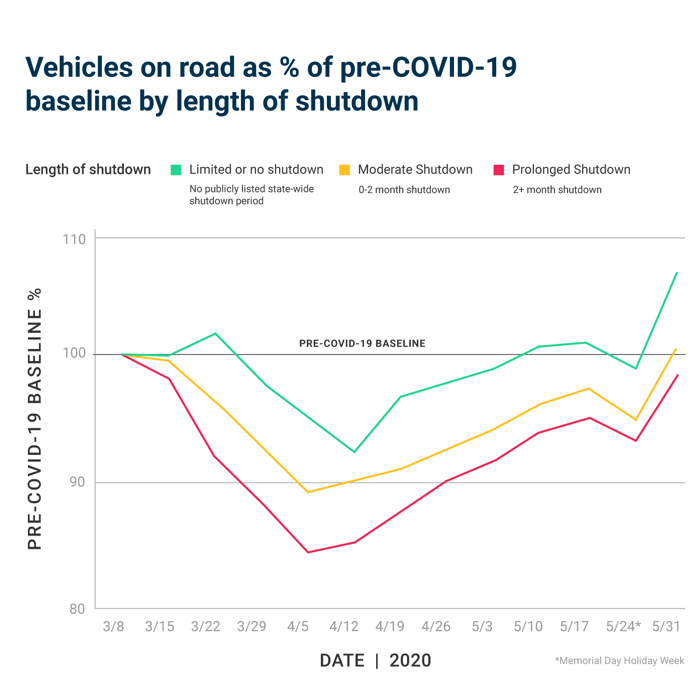
Some states with limited shutdown guidelines, like Iowa and Nebraska, not only experienced very modest declines in baseline commercial driving activity (showing a 10% decline at worst), but more recently have started to exceed pre-COVID-19 activity. Other states with some regional restrictions still in place, like New Jersey, California, and New Mexico, are still experiencing a 5-10% reduction in commercial driving activity compared to pre-COVID-19 baseline levels. This demonstrates that the level of commercial driving activity varies by state and the severity of shutdown orders that state experienced.
2. Industry impact varies widely—education most impacted, long haul and construction remain stable
While changes to U.S. commercial transportation have generally begun to return to pre-COVID-19 levels, industries tell a different side of the story. The impact of COVID-19 is starker when it comes to the different types of customers and services a fleet supports.
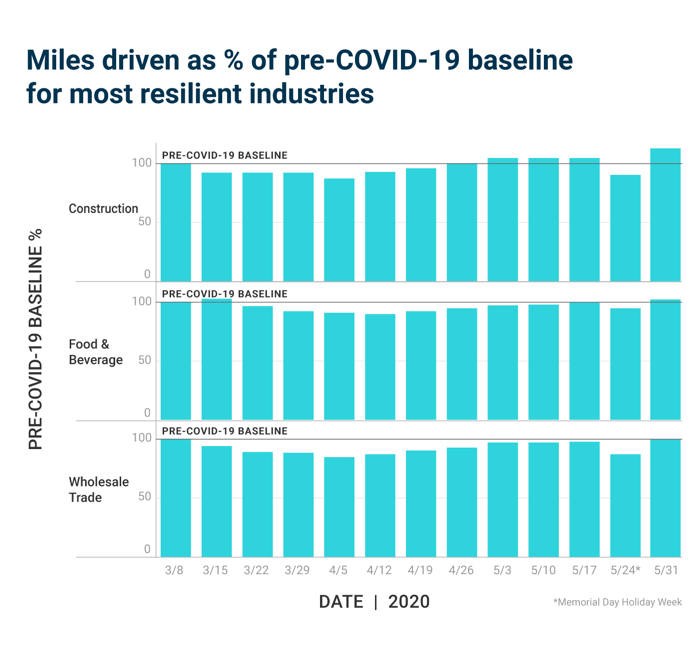
For example, long haul transportation—an industry supporting the transport of many essential products like groceries or medical equipment—experienced a quick recovery from COVID-19. Food and beverage and wholesale trade transportation have also essentially reached pre-COVID-19 commercial driving activity.
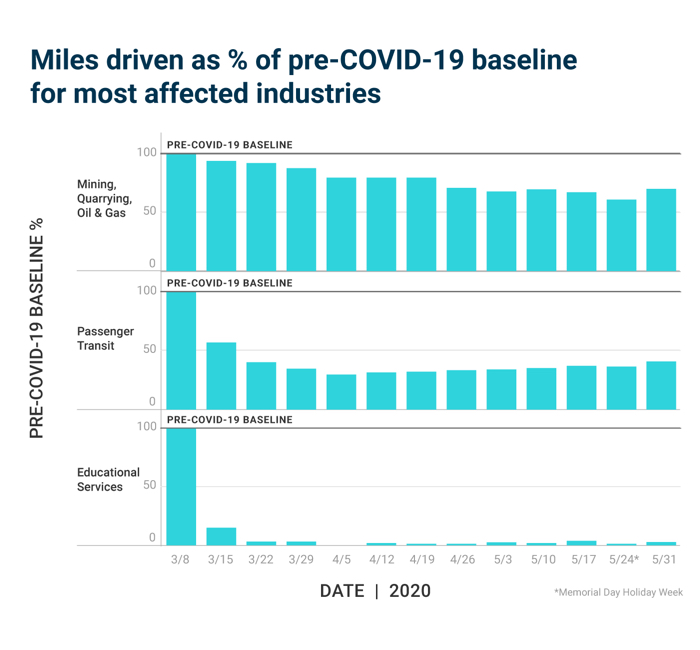
This is in sharp contrast to other industries like passenger transit and education. With some schools still unsure of whether classes will be held in the fall and travel or leisure activities on hold for the foreseeable future, these two industries have experienced a sustained impact from the pandemic. Passenger transit activity has stabilized at around 35% of pre-COVID-19 levels and educational services activity remains below 10%. Other industries, like oil and gas, have not yet recovered from COVID-19’s implications, operating at 60% of pre-COVID-19 commercial activity.
The construction industry, on the other hand, is starting to clock in more miles, operating at 5% above pre-COVID-19 levels in recent weeks. While requests for new construction projects might have slowed down, existing construction for public works, commercial, or residential projects have largely been allowed to resume work in early phases of some state reopenings if specific safety protocols are followed.
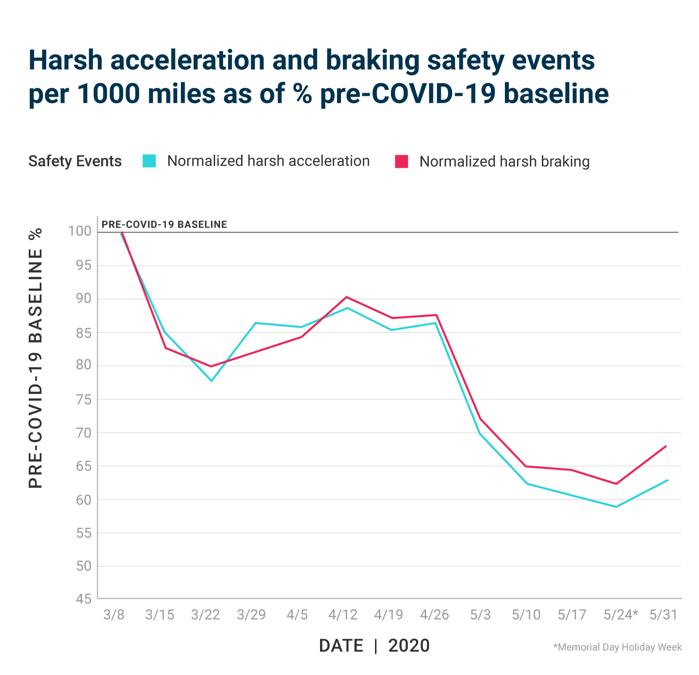
3. With emptier roads, harsh braking and acceleration decreased by 40%
Passenger traffic has decreased significantly since April, making U.S. roadways emptier than they were pre-COVID-19. Data from customers who use our AI dash cams, which use advanced artificial intelligence to detect risky driving behavior like harsh braking and accelerations, shows that COVID-19 has had an impact on the frequency of these behaviors—even when adjusted for decreased mileage.
In fact, there has been a decline in harsh braking and acceleration across all states, culminating at 40% below the pre-COVID-19 baseline. The trend has become even more pronounced as commercial fleets are beginning to resume pre-COVID-19 levels of activity with significantly fewer passenger vehicles on the road, leading to fewer harsh braking and harsh acceleration events per 1000 miles driven. States with comprehensive restrictions still in place are seeing even sharper declines in these behaviors.
On average, a truck traveling at 60 mph requires nearly seven seconds to safely decelerate—more if the driver’s reaction time is slower. When roads are heavily trafficked, this can be challenging to accomplish. As a result, congested freeways can increase the chances of a harsh incident occurring simply because there is less space for a vehicle to slow down. But with fewer vehicles on roads during shelter-in-place orders, roads presented more ideal conditions for safely decelerating, resulting in fewer opportunities for these types of safety incidents to occur.
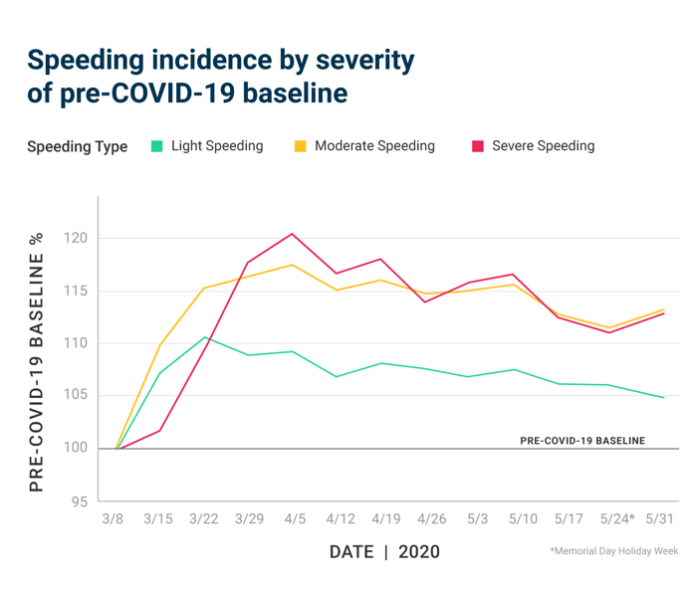
4. Empty roads led to something else—a 20% increase in severe speeding
While some safety-related incidents decreased since COVID-19, others—like speeding—experienced the opposite effect. With roads less congested, drivers might have been tempted to go speeds that they otherwise would not be able to reach on heavily trafficked roads.
Many of our customers use our Vehicle Gateways for live-to-the-second GPS fleet tracking. Because these devices connect directly to a vehicle’s OBD port, they automatically pull engine data like mileage, speed, and fault codes in real-time. Based on speeds reported from these devices, Samsara has classified three different speeding groups:
- Light speeding: 1-5 mph over speed limit
- Moderate speeding: 6-10 mph over speed limit
- Severe speeding: 11+ mph over speed limit
In early April, severe speeding rose 20% above the pre-COVID-19 baseline, indicating that while there may be a decline in some risky driving behavior (like harsh braking and accelerations), there are certain driving behaviors that are making roads more dangerous too.
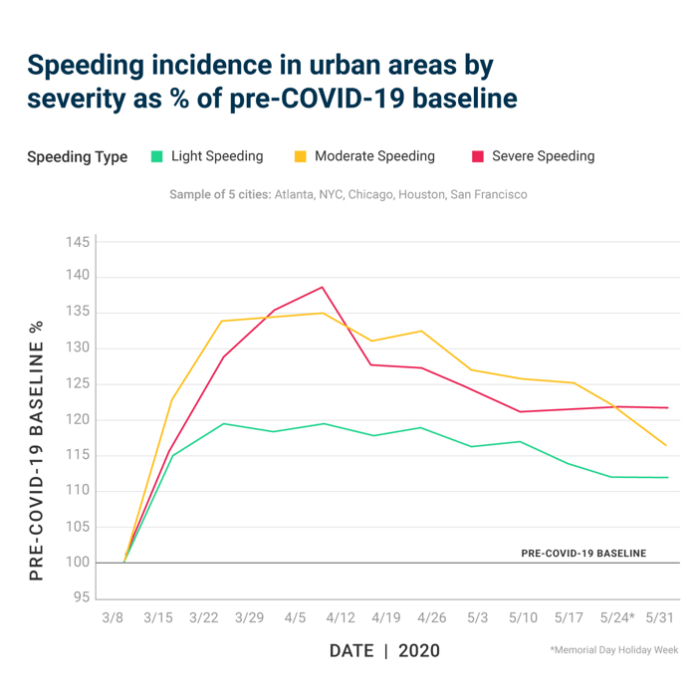
Large cities—especially those with strict shelter-in-place guidelines—have seen empty roads like never before and experienced an even larger increase in severe speeding. A sample of five cities (Atlanta, NYC, Chicago, Houston, and San Francisco) reveals speeding jumped 40% in early April, compared to the 20% increase nationwide. However, speeding started to decrease in May, as states began to lift shelter-in-place orders and more vehicles returned to the roads.
by Ali Akhtar. Samsara
Category: Connected Fleet News, Driver Stuff, Featured, Fleet Diagnostics & Software, Fleet Tracking, General Update, News, Safety
Subscribe
If you enjoyed this article, subscribe to receive more just like it.