


After a long soft patch in the U.S. freight cycle, we see the industry on the cusp of a new cycle in the months to come.

Cass Transportation Indexes reports that April saw another decline in rates, both month-to-month, and once again on a much larger scale y/y
Inferred Freight Rates
The rates embedded in the two components of the Cass Freight Index declined 11.9% y/y in April, after falling 8.3% in March.
- Cass Inferred Freight Rates decreased 1.2% m/m after a 0.4% decline in March. Seasonally adjusted, inferred rates were down 2.7% m/m, due to modal mix shifts, lower fuel prices, and market pressure.
- Fuel prices are transitioning from an inflationary factor to a deflationary one as we pass the anniversary of the fuel price spikes that followed Russia’s invasion of Ukraine last year. Additionally, recent OPEC production cuts have failed to support oil prices as demand declines.
- We estimate lower fuel prices will knock about 5% off freight rates y/y starting mid-Q2.
- While fuel is a big factor, there’s clearly also still market pressure on rates.
- Based on the normal seasonal pattern of this index, freight rates would increase y/y in May, but the mix noise which pressed inferred rates higher in April seems unlikely to recur, so further declines seem more likely.
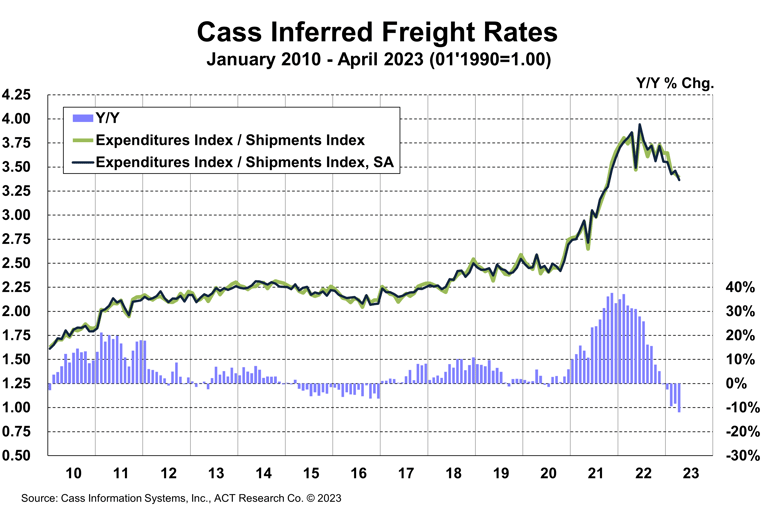
Cass Inferred Freight Rates are a simple calculation of the Cass Freight Index data—expenditures divided by shipments—producing a data set that explains the overall movement in cost per shipment. The data set is diversified among all modes, with truckload (TL) representing more than half of the dollars, followed by less-than-truckload (LTL), rail, parcel, and so on.
Truckload Linehaul Index
The Cass Truckload Linehaul Index, which measures changes in linehaul rates, fell 0.8% m/m in April to 146.6, after a 0.6% m/m decline in March.
- On a y/y basis, the Cass Truckload Linehaul Index fell 12.3% y/y in April after a 9.6% y/y decline in March.
- As a broad truckload market indicator, this index includes both spot and contract freight. With spot rates already down significantly, the larger contract market is likely to continue adjusting down, if more gradually, but in the same direction.
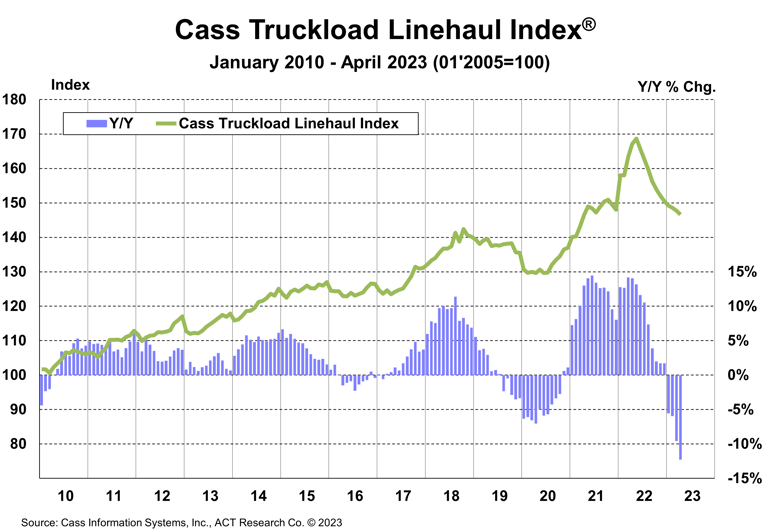
See the Methodology for the Cass Truckload Linehaul Index
Freight Expectations
When conditions will improve is a topic largely reserved for ACT Freight Forecast subscribers. But after a long soft patch, we see the U.S. freight transportation industry on the verge of a new cycle as we begin to transition from the bottoming phase into the early phase of the freight cycle in the months to come.
Of course, demand recovery is an important part of the outlook, but supply trends are shifting as well. Although new equipment production is elevated, we estimate DOT operating authorities have been declining for about seven months now, and employment is broadly following suit.
Though the total trucking employment data series rose by 3,000 jobs in April, March was revised down by 2,500 jobs, leaving little net change. However, the long-distance trucking employment series is telling a different story, and this series is more tightly related to truckload freight markets.
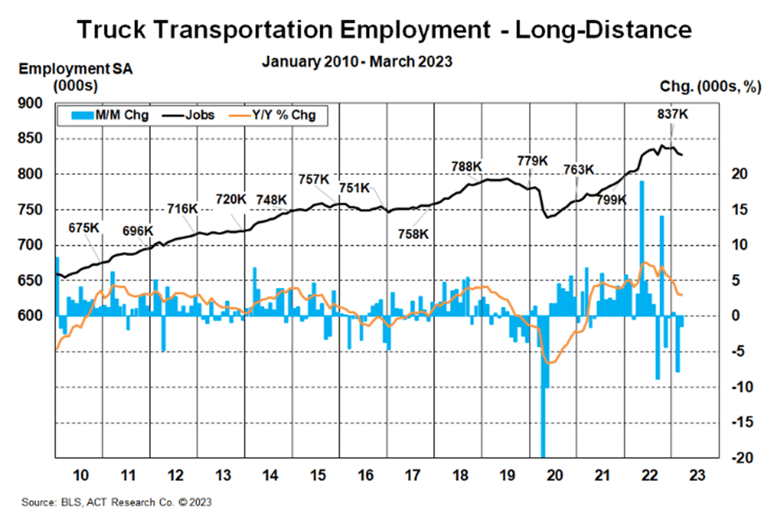
In contrast to the 5,400-job increase in total trucking employment so far this year through April (+2,400 in Q1), long-haul trucking jobs declined by 8,700 jobs in Q1’23, or 1.0%, as shown in the chart. While still up 3.0% y/y in that latest March data point, the series will be down on a y/y basis by June on its current level. Since trends in employment follow trends in freight rates, long-haul jobs are set to decline this year.
For more on the future direction of freight markets, the ACT Research Freight Forecast provides analysis and forecasts for a broad range of U.S. freight measures, including the Cass Freight Index, Cass Truckload Linehaul Index, and DAT spot and contract rates by trailer type. The service provides monthly, quarterly, and annual predictions for the TL, LTL, and intermodal markets over a two- to three-year time horizon, including capacity, volumes, and rates. The Freight Forecast is released monthly in conjunction with this report.
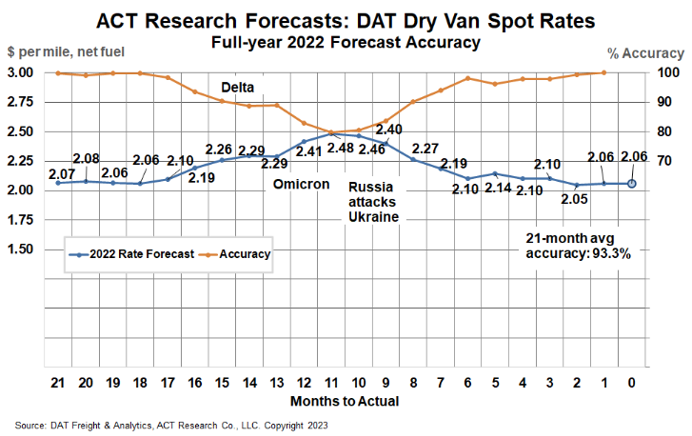
How have their forecasts performed? For 2022, ACT’s forecasts for the shipments component of the Cass Freight Index were 97.5% accurate on average for the 24-month forecast period. Our January 2021 forecast, two full years out, was 99.8% accurate.
(As a reminder, ACT Research’s Tim Denoyer writes this report.)
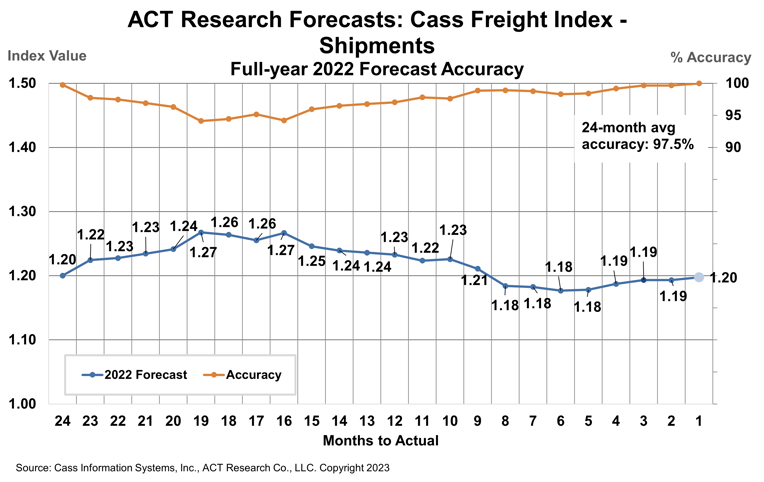
ACT Research’s full-year 2022 DAT spot rate forecasts were 99.7% accurate from Q2’21 (19-21 months out) for dry van and 98.5% for reefer. DAT dry van spot rates, net fuel, finished 2022 at $2.06 per mile, in line with our forecasts to the penny from 18 and 19 months out (June and July 2021).
Source: Cass Transportation Index
The Cass Transportation Indexes accurately measure changes in North American freight activity and costs based on $44 billion in paid freight expenses for the Cass customer base of hundreds of large shippers.
Category: Connected Fleet News, Equipment, Featured, General Update, Management, News
Subscribe
If you enjoyed this article, subscribe to receive more just like it.


