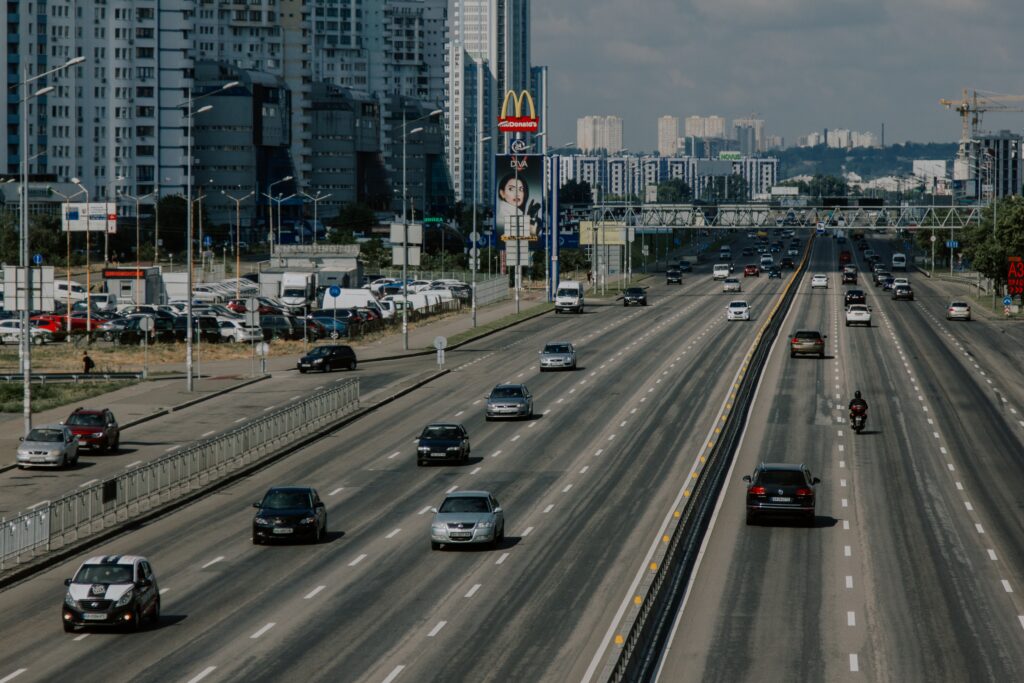
Average Business Mileage Across the U.S. Increased to 65% of Pre-pandemic Levels

Business mileage trends have proven to be an indicator of economic health and growth ahead of the Bureau of Labor Statistics’ monthly jobs report
Motus which serves the world’s largest retained pool of drivers Flash Reports show how U.S. business driving activity has evolved throughout the pandemic, broken down by region and by industry. The numbers show how various geographies and groups are recovering and in some cases thriving during this tumultuous time, as well as how local shutdowns and policies are impacting grey fleets.
Average business mileage across the U.S. has increased to 65% of pre-pandemic levels. Regionally, the Western U.S. is trending at about 67% of pre-pandemic levels, business mileage in the South and Midwest has grown to 66% of pre-pandemic levels and Northeast mileage activity has grown to 60% of pre-pandemic levels.
While activity levels vary from region to region, there is an even wider variety among industry sectors and their many subsectors. Mileage trended upward rapidly in most industries in May and June – most likely due to widespread reopening efforts and pent-up demand. Recent months have seen more volatility in mileage in different industry sectors—illustrating how business activity trends differ depending on where and how companies operate, for instance:
- Food & Beverage (79% of pre-pandemic levels, a +48% increase over the week of 4/5)
- Construction & Building Materials (73% of pre-pandemic levels, +18% above the WorkForward average)
- Machinery (63% of pre-pandemic levels, +16% above the WorkForward average)
- Business Services (60%, +24% above the average)
- Hospitals & Healthcare (60% of pre-pandemic levels, +7% above the average)
- Pharmaceutical/Biotech & Medical Devices (56% of pre-pandemic levels, +29% above the average)
- Retail (55% of pre-pandemic levels, +9% above the average)
- Energy & Environmental (45%, +22% above the average)
- Automotive (45%, +3% above the average)
- Manufacturing (44%, +36% above the average)
As we head into the fall season, the pandemic continues to disrupt business activity in the U.S. The severity of the disruption varies by region and industry, and many leaders are monitoring multiple leading indicators of business activity. This report covers business mileage – an indicator of field activity levels—and presents a current view of economic growth and recovery for different regions and industry sectors.
NATIONAL BUSINESS MILEAGE TREND
National business mileage activity has shifted from a plateau to a slow but steady increase over recent months. Current mileage activity remains higher than the stay-at-home phase, but incremental growth is at a much slower pace, and has not fully recovered to pre-pandemic levels. As people WorkForward, field activity is 85% higher than the week of April 5th, the lowest level of business mileage in 2020.
Category: Driver Stuff, Featured, Fleet Tracking, General Update, News


