


Cass Freight Index

It Wasn’t Cheap, But the Freight Came Through
| December 2021 | Year-over-year change | 2-year stacked change | Month-to-month change | Month-to-month change (SA) | |
| Cass Freight Index – Shipments | 1.208 | 7.7% | 14.8% | 0.2% | 4.2% |
| Cass Freight Index – Expenditures | 4.419 | 43.6% | 62.3% | 3.4% | 6.6% |
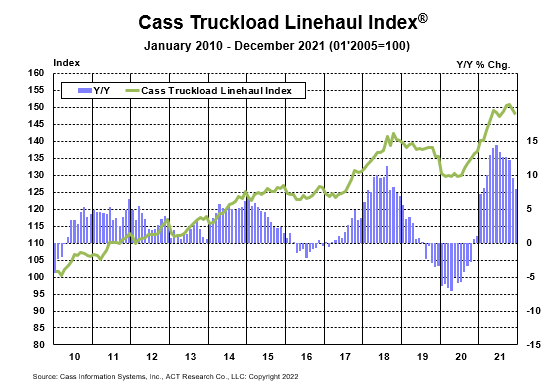
| Truckload Linehaul Index | 148.0 | 8.0% | 9.2% | -1.0% | -1.0% |
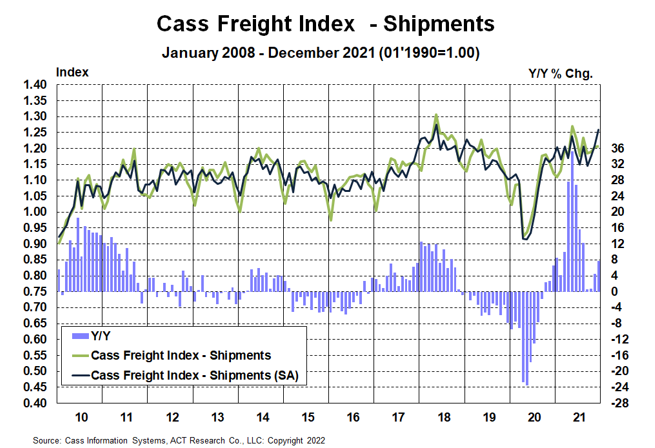
Cass Freight Index – Shipments
The U.S. transportation sector delivered in time for the holidays as the shipments component of the Cass Freight Index® accelerated to 7.7% y/y growth in December from 4.5% in November.
Though virtually unchanged m/m, the Cass shipments index jumped 4.2% from November to December on a seasonally adjusted (SA) basis, as shipment volumes held firm despite the normal holiday slowdown.
Though the record backlog of 105 containerships off Southern California and sharp declines in intermodal volumes in early 2022 still demonstrate capacity constraints on freight volumes, the strong finish to 2021 shows progress as the trucking industry has begun to build driver and equipment capacity in spite of extraordinary challenges.
See the methodology for the Cass Freight Index.
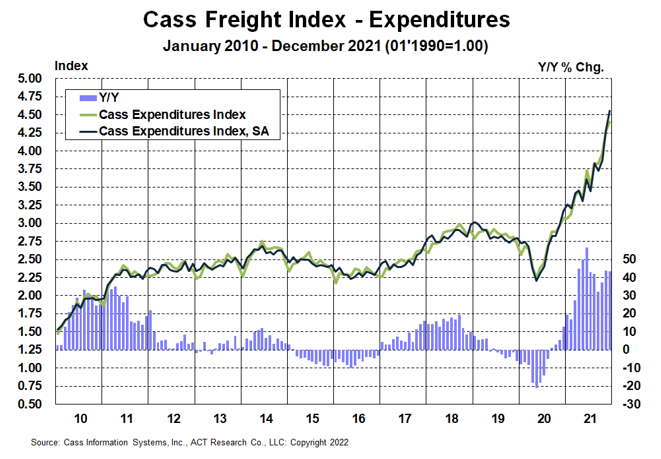
Cass Freight Index – Expenditures
The expenditures component of the Cass Freight Index, which measures the total amount spent on freight, rose to another new record level of 4.419, up 44% y/y in December and 3.4% m/m.
- On a seasonally adjusted basis, expenditures were literally off the chart (not to worry, the axis has been adjusted), rising 6.6% m/m in December, with a slightly larger contribution from higher volumes, and to a lesser degree from higher rates.
- On a two-year stacked basis, the Expenditures component of the Cass Freight Index was up 62% in December, with shipments up 15% and rates up 41%.
This index rose 38% in 2021, after a 7% decline in 2020 and no change in 2019. Tougher comparisons in the coming months will naturally slow these y/y increases, but just using normal seasonality from here, the increase in 2022 will still be about 25% at this trend level.
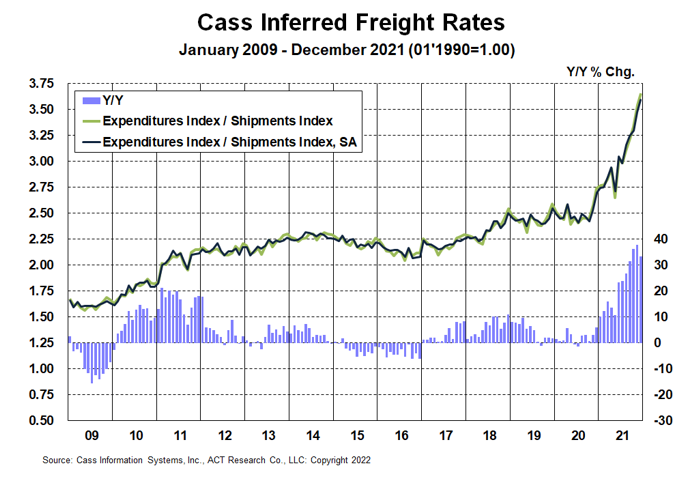
Inferred Freight Rates
A simple calculation of the Cass Freight Index data (expenditures divided by shipments) produces a data set of inferred freight rates that explains the overall movement in cost per shipment.
- The freight rates embedded in the two components of the Cass Freight Index decelerated to a 33% y/y increase in December from 38% in November.
- Cass Inferred Freight Rates rose another 3.5% m/m on a seasonally adjusted basis in December, to a new record.
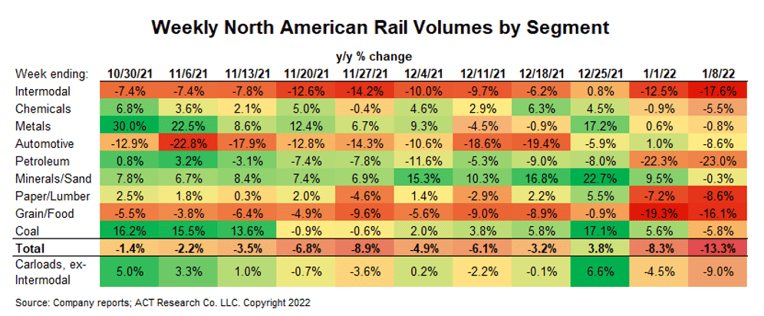
- Significant excess miles in the freight network are persisting into 2022 as the economy faces ongoing disruptions. Chassis production improved significantly in Q4’21, but only enough to turn the direction of the chassis fleet from contraction to slight growth, and the chassis fleet remains far from what is needed to address rail network congestion.
This tight intermodal offtake capacity continues to press imports into the truckload market, particularly off the West Coast, raising the truckload length of haul (LOH) 20% y/y in December as trucking continues to take share from a challenged rail network.
These excess miles are a significant part of the 33% y/y increase in inferred freight rates, because, as noted in the calculation above, these rates are on a per shipment basis, rather than a per mile basis. Higher fuel surcharges, modal mix, and accessorial fees are also factors which are not reflected in the Cass Truckload Linehaul Index. With a higher proportion of smaller LTL shipments in December, modal mix worked to slow the increase this month.
For full-year 2021, Cass Inferred Freight Rates rose 23% from 2020, and heading into 2022 are up even more than that on a y/y basis, albeit likely to slow from the 33% increase in December. The data set is diversified among all modes, with truckload representing more than half of the dollars, followed by LTL, rail, parcel, and so on.
Truckload Linehaul Index
The Cass Truckload Linehaul Index® fell 1.5 points in December to 148.0 from 149.5 in November, down 1.0% m/m and up just 8.0% y/y, slower than the 9.6% increase in November.
- This data series trends below the 22% increase in public Q3 TL fleet rates due to a large increase in LOH resulting from rail service issues pressing longer-haul shipments onto the highways. Accessorials are also part of the difference, but likely much smaller than the mix effects from longer LOH, which reduce the rate per mile even as cost per shipment rises.
- We estimate longer LOH alone (with its accompanying lower linehaul rates) lowered this index by about 3% in December.
Strong freight demand and tight capacity are continuing to press this index higher, but have been more than outweighed in the past two months by mix. As chassis capacity gradually recovers and rail congestion eases over the course of 2022, a reversal to shorter length of haul will likely add upward pressure to this index above and beyond market rate increases.
See the methodology for the Cass Truckload Linehaul Index.
Freight Expectations
The U.S. freight cycle has been on the upswing since mid-2020. Fundamentals remain positive, with a strong consumer balance sheet and significant additional need for restocking.
While signs that an easing in the everything shortage were beginning to emerge prior to the Omicron wave, the challenges to industry capacity are worsening again as 2022 begins. Absenteeism is surging across drivers, maintenance staff, and administrative personnel at transportation companies, and the effects of the latest COVID variant on factory workers will likely slow the recovery in equipment production.
But Omicron is likely to be more needle-shaped than prior variants, and after the spike in cases, there is a silver lining that its milder symptoms may broadly reduce pandemic risks, which will have major implications for freight market dynamics.
The ACT Freight Forecast report provides monthly predictions for the truckload, LTL, and intermodal markets, including capacity, volumes, and rates, and forecasts for the shipments component of the Cass Freight Index and the Cass Truckload Linehaul Index through 2023.
In March 2021, ACT predicted a 12% increase in the shipments component of the Cass Freight Index for 2021, just two thousandths from the actual result.
Category: Connected Fleet News, Driver Stuff, Equipment, Featured, Fleet Tracking, General Update, Management, News, Transit News, Vehicles
Subscribe
If you enjoyed this article, subscribe to receive more just like it.


