


Cass Transportation Indexes – July 2022

Lower fuel prices were part of the decrease, but with looser truckload market conditions, further deceleration is very likely
Steady as She Goes
| July 2022 | Year-over-year change | 2-year stacked change | Month-to-month change | Month-to-month change (SA) | |
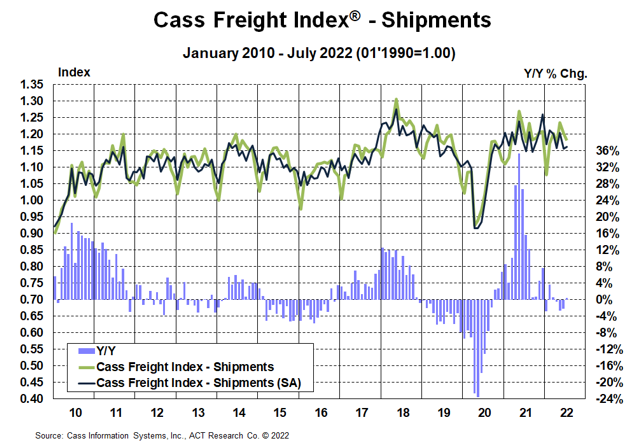
| Cass Freight Index – Shipments | 1.182 | 0.4% | 16.1% | -1.7% | 0.6% |
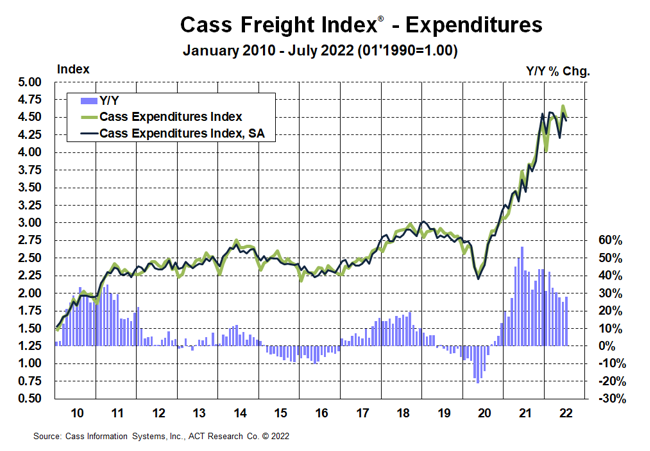
| Cass Freight Index – Expenditures | 4.499 | 28.2% | 83.5% | -3.6% | -2.4% |
| Cass Inferred Freight Rates | 3.806 | 27.6% | NA | -1.8% | -2.9% |
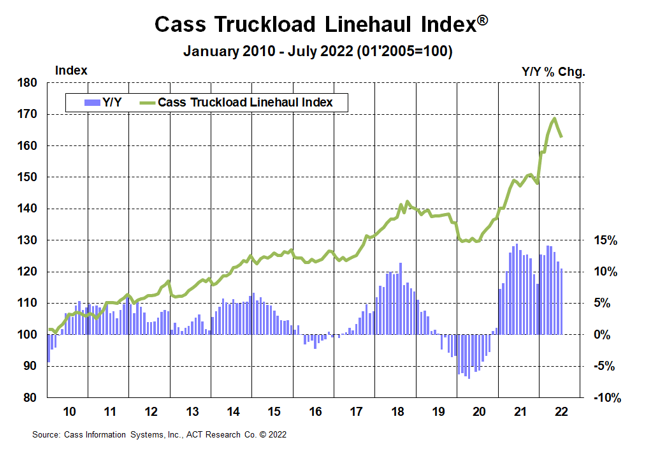
| Truckload Linehaul Index | 162.7 | 10.5% | 25.3% | -1.8% | — |
Cass Freight Index – Shipments
The shipments component of the Cass Freight Index® rose 0.4% on a y/y basis in July, after a 2.3% decline in June and in line with expectations.
- On a seasonally adjusted (SA) basis, shipments rose 0.6% m/m in July, after a 4.1% decline in June.
- Freight demand has flattened out this year with inflation near 9% and significant substitution from goods back to services. Considering the extraordinary goods consumption during the pandemic, a reversal as services have reopened shouldn’t be much of a surprise.
- Inventory to sales ratios are still below historic norms, so this major tailwind for freight demand over the past 18 months is likely fading but has not turned to a headwind at this point.
Normal seasonality from this index level would imply shipments down slightly y/y in Q3 and down 4%-5% y/y in Q4.
See the methodology for the Cass Freight Index.
Cass Freight Index – Expenditures
The expenditures component of the Cass Freight Index®, which measures the total amount spent on freight, fell 3.6% m/m in July from the record level in June, evenly split with shipments down 1.7% and rates down 1.8%.
- The Cass Expenditures Index was still 28% higher than year-ago levels in July, a slight reacceleration, though likely short-lived.
- On a SA basis, expenditures fell 2.4% m/m in July, with shipments up 0.6% m/m and rates down 2.9%.
We estimate roughly 8pps-10pps of the y/y increase is currently due to fuel prices alone, and part of the m/m decline in rates was due to lower fuel prices. This index includes changes in fuel, modal mix, intramodal mix, and accessorial charges.
Simply following normal seasonality from here, this index is on track for a 23% increase and would turn down on a y/y basis in December.
Inferred Freight Rates
The freight rates embedded in the two components of the Cass Freight Index® still rose 28% y/y in July, a slight deceleration from June.
- Cass Inferred Freight Rates, a series that tracks changes in the cost of a shipment, fell 1.8% m/m (2.9% SA) in July. Lower fuel prices were part of the decrease, but with looser truckload market conditions, further deceleration is very likely.
- While there has been some mix-related noise in recent months, a 3-month moving average of this data series peaked in April in seasonally adjusted terms and was down 1.5% from that level with the July data.
With the tight supply/demand balance in U.S. trucking markets easing considerably this year, industry rates are topping out and set to slow sharply in the months to come. Based on the weekly trends, fuel should provide additional relief in August as well. Diesel prices continue to reflect elevated refining margins, and could fall further, but could also easily revert higher if the situation in Europe worsens.
While shippers aren’t seeing any real savings yet, such relief is now highly probable, which is welcome news for the broader inflation picture.
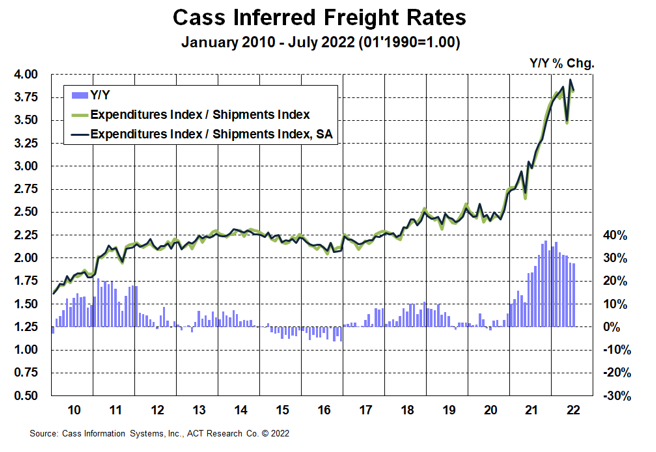
Cass Inferred Freight Rates are a simple calculation of the Cass Freight Index data, expenditures divided by shipments, producing a data set that explains the overall movement in cost per shipment. The data set is diversified among all modes, with truckload representing more than half of the dollars, followed by LTL, rail, parcel, and so on.
Truckload Linehaul Index
The The Cass Truckload Linehaul Index® rose 10.5% y/y in July to 162.7 after rising 11.6% y/y in June.
- On a m/m basis, the Cass Truckload Linehaul Index® fell 1.8% for the second straight month. After an extraordinary truckload rate cycle over the past two years, the market balance has shifted, with capacity now growing briskly and demand falling slightly year-to-date. This is starting to press the Cass Truckload Linehaul Index® lower.
- Similar to what has occurred in the spot market, the surge in fuel costs to shippers, which are excluded from this index, will also likely act as a brake on linehaul rates.
See the methodology for the Cass Truckload Linehaul Index.
Freight Expectations
One of the most interesting observations about truckload spot rates this year is the symmetry of the decline of about 75c-80c/mile, ex-fuel, which is exactly the amount they jumped after the initial market tightening in 2H’20. Spot rates have rebounded a bit in recent weeks, ex-fuel, with at least some temporary relief from the significant drop in diesel prices.
This brings to mind some of our favorite axioms, like “the laws of supply and demand have yet to be repealed” and “the cure for high prices is high prices.”
Now that the pendulum is swinging, “how bad?” and “how long?” have become some of the most crucial questions about the freight rate cycle. The ACT Freight Forecast report provides monthly, quarterly, and annual predictions for the truckload (TL), LTL, and intermodal markets, including capacity, volumes, and rates. The report provides monthly updates of forecasts for the shipments component of the Cass Freight Index® and the Cass Truckload Linehaul Index® through 2024, as well as DAT spot rates by trailer type, including and excluding fuel surcharges.
Release date: We strive to release our indexes on the 12th of each month. When this falls on a Friday or weekend, our goal is to publish on the next business day.
Category: Connected Fleet News, Driver Stuff, Equipment, Featured, Fuel & Oil, General Update, Management, News, Transit News, Vehicles
Subscribe
If you enjoyed this article, subscribe to receive more just like it.


