


Demand Flattens; Deflation is Here

Cass Transportation Indexes reports two key drivers of growth for the freight cycle–goods consumption and inventory restocking–are faltering
After a nearly two-year cycle of surging freight volumes, two key drivers of growth for the freight cycle–goods consumption and inventory restocking–are faltering.
Combined with a major improvement in driver availability (27,300 new jobs added in the past two months), all signs continue to point to a change in the trajectory of rates in the coming months.
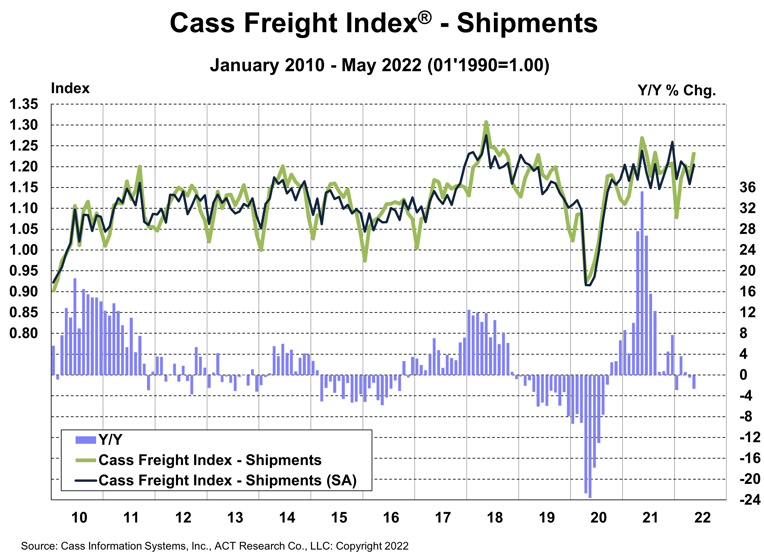
Cass Freight Index – Shipments
The shipments component of the Cass Freight Index® rose 5.4% m/m in May (up 4.0% SA), more than recovering the 2.6% decline in April. On a tough comparison, the y/y decline worsened to 2.7%, as expected, but the result was 1% ahead of the ACT Research estimate.
- We don’t typically look beyond 2-year stacks, bit since comparisons to 2020 have little meaning, the shipments component of the Cass Freight Index was up 0.6% on a 3-year stack vs -1.8% last month. These are similar to the conditions of the 2019 downturn.
- The effects of lockdowns in China are still ahead and are likely to be muted for a number of reasons.
- After a nearly two-year cycle of surging freight volumes, two key drivers of growth for the freight cycle–goods consumption and inventory restocking–are faltering.
Normal seasonality from here would have the shipments component back up 2% y/y in June and flat to up 1% for 2022. The news from the retail sector and in the oil markets suggest that’s probably optimistic, but at this point, it’s a pretty stable environment. No major downturn.
See the methodology for the Cass Freight Index.
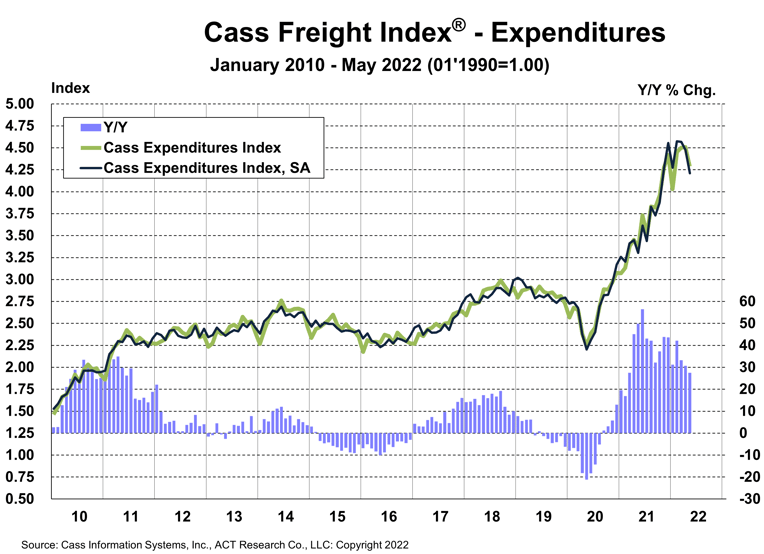
Cass Freight Index – Expenditures
The expenditures component of the Cass Freight Index, which measures the total amount spent on freight, fell 4.9% m/m in May with shipments up 5.4% and rates down 9.8%. The m/m noise on rates is largely mix, with more LTL and less TL in the data set, and on a y/y basis expenditures were up 28% y/y, versus a 31% increase in April.
- On a seasonally adjusted basis, expenditures fell 5.9% m/m, with shipments up 4.0% m/m and rates down 9.5%.
This index rose 38% in 2021, after a 7% decline in 2020 and no change in 2019. Tougher comparisons in the coming months will naturally slow these y/y increases, particularly next month. With a normal 0.5% m/m increase, the y/y change would slow to 15% from 28% in May. And simply using normal seasonality from here, the increase in 2022 will be about 19% after a 30% increase in the first half.
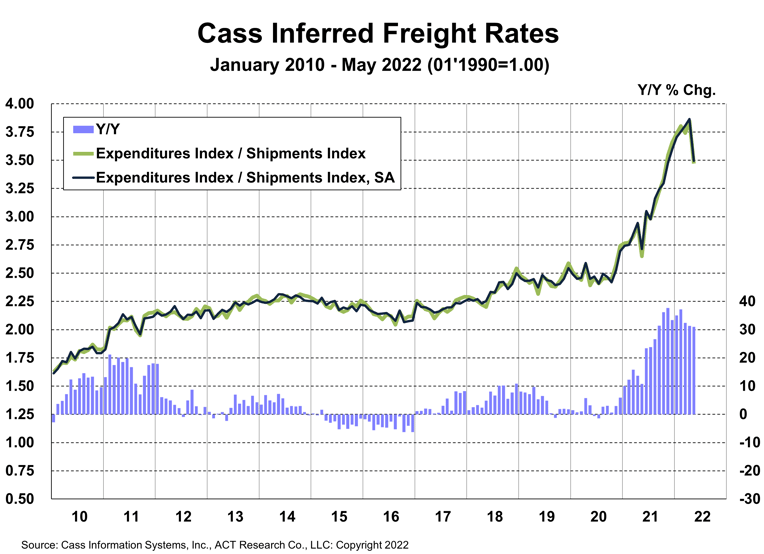
Inferred Freight Rates
The freight rates embedded in the two components of the Cass Freight Index still rose 31% y/y in May, in line with April, despite a 9.8% m/m decline. Comps, what can we say?
- Cass Inferred Freight Rates® fell 9.5% m/m on a seasonally adjusted basis in May.
It’s tempting to see this as a sign that freight costs have peaked, and on a y/y basis that is true, as inferred rates will slow all the way to 13% y/y in June on normal seasonality. Supply/demand fundamentals have certainly turned looser this year, so it wouldn’t be an unreasonable conclusion. However, as noted above, the drop was largely due to mix, and with fuel prices still adding upward pressure, the descent is not straightforward.
These rates are representative of the industry’s mix of contract and spot rates, but the 15% y/y decline in rates ex-fuel in the more real-time spot markets in early-June portends a downcycle on the horizon.
Significant risks, such as new COVID variants, remain and equipment capacity remains limited and could tighten further if the Russia/Ukraine war or China lockdowns worsen the chip shortage. But 2022 has featured a big improvement in driver availability, and a flattening of freight demand. This is a deflationary combination, though it will take several months to filter from the spot market into contract rates.
There have been tentative signs of recovering intermodal network fluidity as chassis production continues to accelerate and brisk hiring continues. Intermodal volumes continue to underperform the shipments component of the Cass Freight Index, though to a lesser degree as the latter has softened in recent months. Rail network congestion continues to add to Cass Inferred Freight Rates via excess miles in the freight network, but this effect is set to reverse as intermodal volumes are uniquely poised to grow y/y in 2H’22.
After rising 23% in 2021, the normal season pattern from here would suggest an 18% increase in 2022 inferred rates.
Cass Inferred Freight Rates are a simple calculation of the Cass Freight Index data, expenditures divided by shipments, producing a data set that explains the overall movement in cost per shipment. The data set is diversified among all modes, with truckload representing more than half of the dollars, followed by LTL, rail, parcel, and so on.
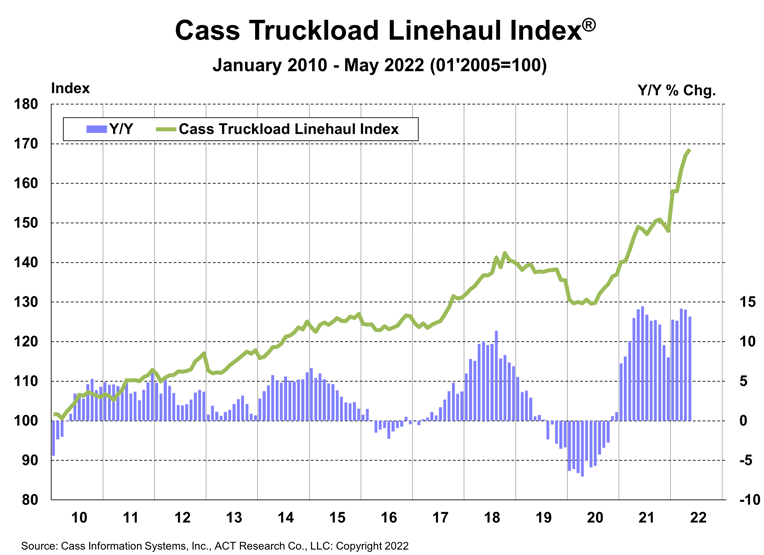
Truckload Linehaul Index
The Cass Truckload Linehaul Index® rose 13.2% y/y in May to 168.6 after rising 14.1% y/y in April.
- While truckload rates have had an extraordinary cycle, the key leading indicators have fallen sharply over the past few months, which we expect to limit further upside in the Cass Truckload Linehaul Index and change its trajectory in the coming months.
- With the large declines in spot rates coming just ahead of the big spring contract season, the lead time between spot and contract may be compressed somewhat.
See the methodology for the Cass Truckload Linehaul Index.
Excess miles, rising fuel surcharges, and accessorial fees are all factors included in the inferred rate series, but not the Cass Truckload Linehaul Index. The true increase in freight cost, depending on how these factors shake out, is somewhere between the 14% y/y increase in the Cass Truckload Linehaul Index and the 31% y/y increase in the inferred rate. Depending on the mode, we estimate fuel costs alone are currently adding roughly 10% to the cost of freight on a y/y basis, clearly the largest part of the difference.
Freight Expectations
Growing evidence of weaker goods consumption, rising services substitution, and rebuilt inventories, with some categories now overstocked, was perhaps the most impactful news in freight this month.
Just as the freight plateau is being reinforced, trucking employment rose the most on record with 27,300 new jobs added in the past two months. The nearly 5% y/y growth rate in the BLS Truck Transportation Employment data series, along with the elevated ACT Driver Availability Index, show a very different market balance than just six months ago.
Now that the pendulum has begun to swing, “how bad?” and “how long?” have become some of the most crucial questions. The ACT Freight Forecast report provides monthly, quarterly, and annual predictions for the TL, LTL, and intermodal markets, including capacity, volumes, and rates. The report provides monthly updates of forecasts for the shipments component of the Cass Freight Index and the Cass Truckload Linehaul Index through 2024, as well as DAT spot rates by trailer type, including and excluding fuel surcharges.
The Cass Transportation Indexes accurately measure changes in North American freight activity and costs based on $37 billion in paid freight expenses for the Cass customer base of hundreds of large shippers.
Category: Driver Stuff, Equipment, Featured, General Update, Management, News
Subscribe
If you enjoyed this article, subscribe to receive more just like it.


