


Freight Rates Down 21%; Truckload Cycle Nears Bottom

Cass Transportation Index reports dynamics of the freight market continue to shift, leading us into the late phase of the freight cycle
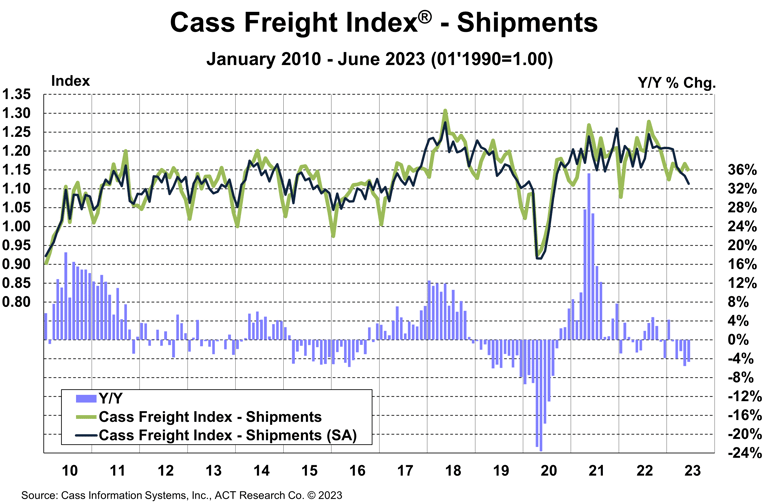
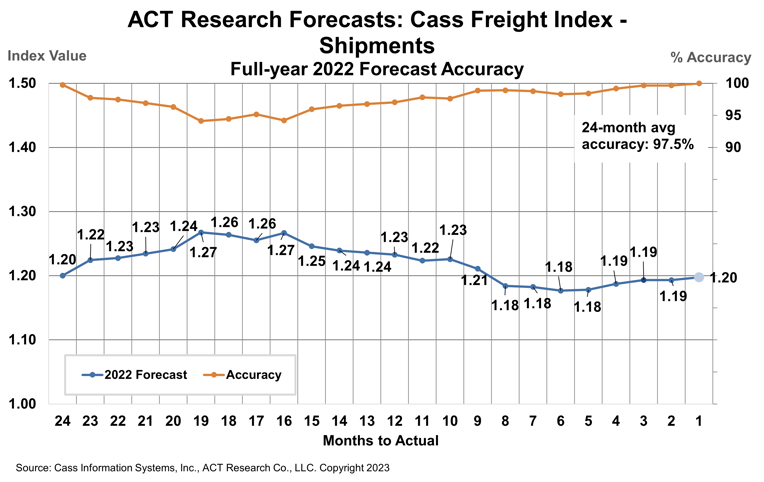
Cass Freight Index – Shipments
The shipments component of the Cass Freight Index® fell 1.6% m/m in June and fell 1.9% m/m in seasonally adjusted (SA) terms.
- On a y/y basis, the index was 4.7% lower in June, after a 5.6% decline in May.
- Freight markets continue to work through a downcycle which featured its first y/y decline 18 months ago. The past three downcycles have ranged from 21 to 28 months.
- Declining real retail sales trends and ongoing destocking remain the primary headwinds to freight volumes, but dynamics are shifting as real incomes improve and the worst of the destock is in the rearview.
In seasonally adjusted terms, the index is now 12% below the December 2021 cycle peak, slightly greater than the peak-to-trough declines in two of the three downcycles in the past dozen years.
With normal seasonality, this index would fall slightly m/m in July and decline about 6% y/y.
See the Methodology for the Cass Freight Index
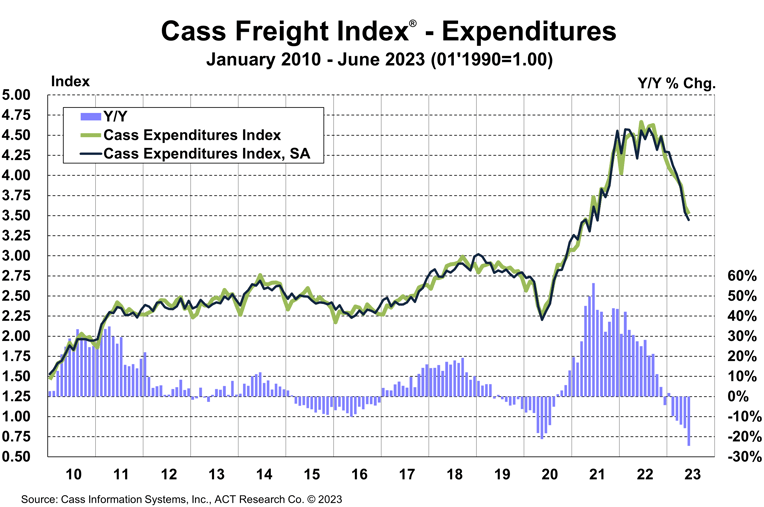
Cass Freight Index – Expenditures
The expenditures component of the Cass Freight Index, which measures the total amount spent on freight, fell 2.6% m/m and 24.5% y/y in June.
With shipments down 1.6% m/m in June (compared to a decline in total spending of 2.6%), we infer rates were down 1.0% m/m (see our inferred rates data series below).
- On an SA basis, this index declined 2.8% m/m, with shipments down 1.9% and rates down 0.9%.
This index includes changes in fuel, modal mix, intramodal mix, and accessorial charges, so is a bit more volatile than the cleaner Cass Truckload Linehaul Index®.
The expenditures component of the Cass Freight Index rose 23% in 2022, after a record 38% increase in 2021, but is set to decline about 17% in 2023, assuming normal seasonal patterns from here. With both freight volume and rates under pressure at this point in the cycle, that assumption is likely optimistic, so we may be looking at a ~20% decline in freight spending this year.
Inferred Freight Rates
The rates embedded in the two components of the Cass Freight Index declined 21% y/y in June, after falling 11% in May.
- Cass Inferred Freight Rates decreased 0.9% m/m SA after a 7.1% decline in May, as contract rates reset lower and, in part, due to lower fuel prices.
- Based on the normal seasonal pattern, this index would rise slightly m/m in July and the y/y decline would tighten to about 17% on noisy comparisons.
- We estimate lower fuel prices are knocking about 5% off freight rates y/y starting in mid-Q2.
- While fuel is a big factor, there’s clearly also still market pressure on rates.
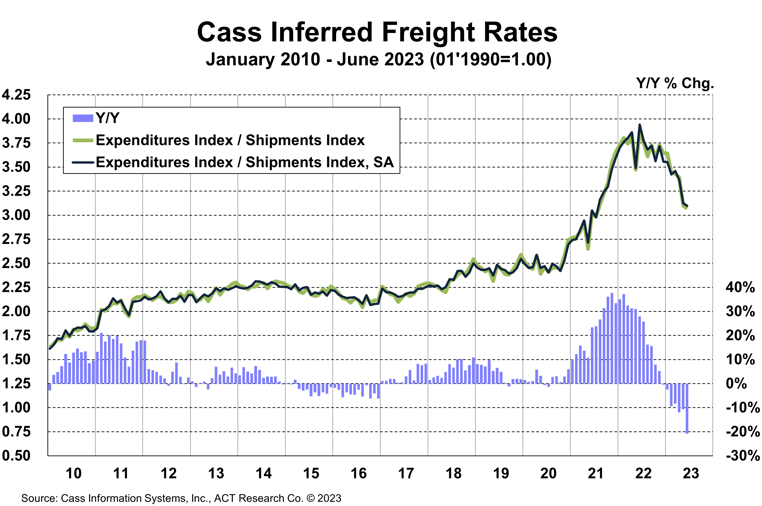
Cass Inferred Freight Rates are a simple calculation of the Cass Freight Index data—expenditures divided by shipments—producing a data set that explains the overall movement in cost per shipment. The data set is diversified among all modes, with truckload (TL) representing more than half of the dollars, followed by less-than-truckload (LTL), rail, parcel, and so on.
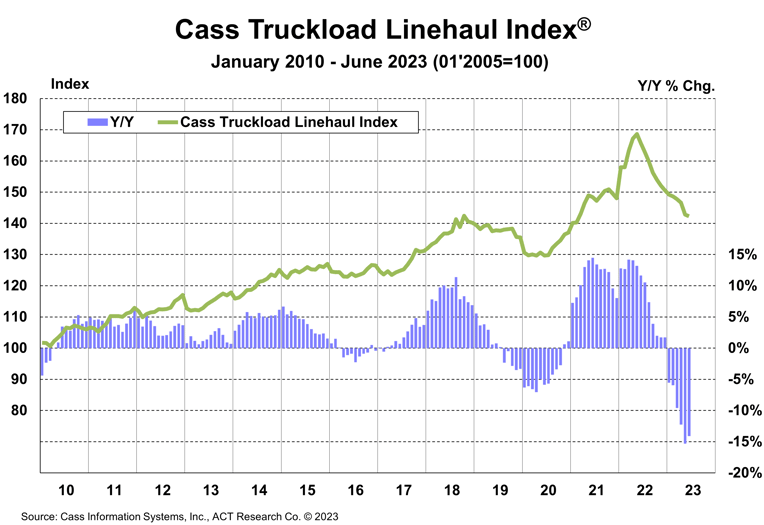
Truckload Linehaul Index
The Cass Truckload Linehaul Index, which measures the per-mile change in linehaul rates, fell 0.4% m/m in June to 142.3, after a 2.6% m/m decline in May.
- Although the June decline was smaller, the 1.5% average decline of the past two months is still nearly twice the 0.8% average of the prior six months.
- On a y/y basis, the Cass Truckload Linehaul Index fell 14.1% y/y in June after a 15.3% y/y decline in May.
- As a broad truckload market indicator, this index includes both spot and contract freight. With spot rates already down significantly, the larger contract market is likely to continue adjusting down.
See the Methodology for the Cass Truckload Linehaul Index
Freight Expectations
The volume downturn appears to be in the later innings, and after a long soft patch, we see the U.S. freight transportation industry on the cusp of a new cycle. We characterize this phase of the cycle as the bottoming phase.
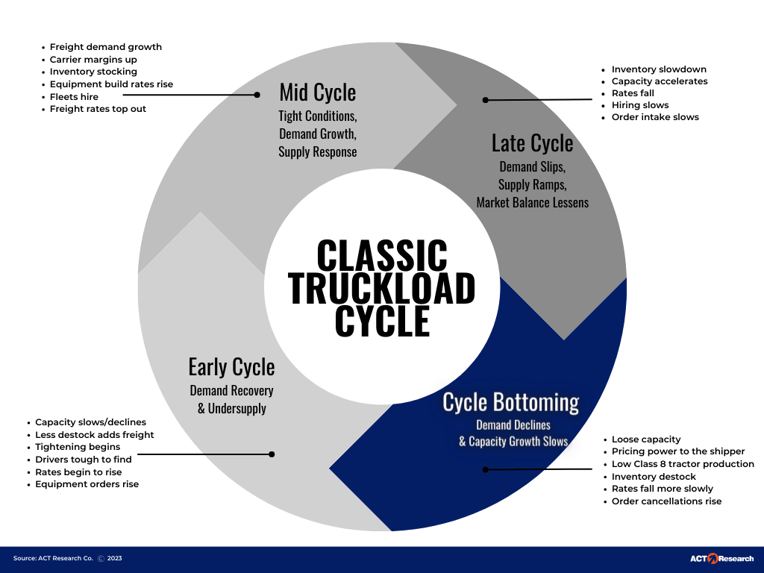
One key ingredient of the bottoming phase, which is absent so far this cycle, is lower equipment production. As Class 8 build rates remain elevated, pressure remains on fleets to seat these tractors.
Our fleet friends suggest that some of the recent strength in Bureau of Labor Statistics (BLS) employment data is owner-operators moving back to for-hire jobs.
Thus, the BLS trucking jobs data likely overstates industry employment trends but has been resilient nonetheless, leading to fewer hours worked. In the months to come, rebalancing will continue, but this dynamic threatens to prolong the bottoming process.
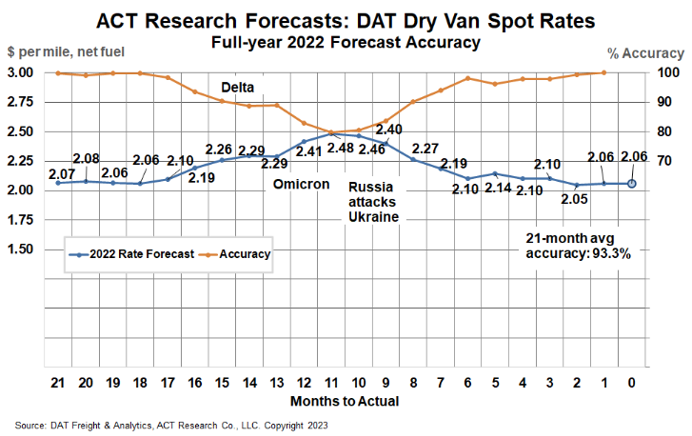
ACT Research’s full-year 2022 DAT spot rate forecasts were 99.7% accurate from Q2’21 (19-21 months out) for dry van and 98.5% for reefer. DAT dry van spot rates, net fuel, finished 2022 at $2.06 per mile, in line with our forecasts to the penny from 18 and 19 months out (June and July 2021).
Release date: We strive to release our indexes on the 13th of each month. When this falls on a Friday or weekend, our goal is to publish on the next business day.
Source: Cass Freight Index.
Category: Featured, General Update, Management, News
Subscribe
If you enjoyed this article, subscribe to receive more just like it.


