


Real-time Mapping Shows Gridlock Status in 20 Major U.S. Cities
Interested in what your fleets are going to face on the roads at rush hour?
Geotab, a leader in IoT and connected transportation, has revealed a series of interactive maps showcasing traffic patterns across the United States. Depicting drastic speed reductions during peak rush hour times, the Gridlocked Cities maps also reveal stark differences in congestion patterns throughout the day in 20 major American cities.
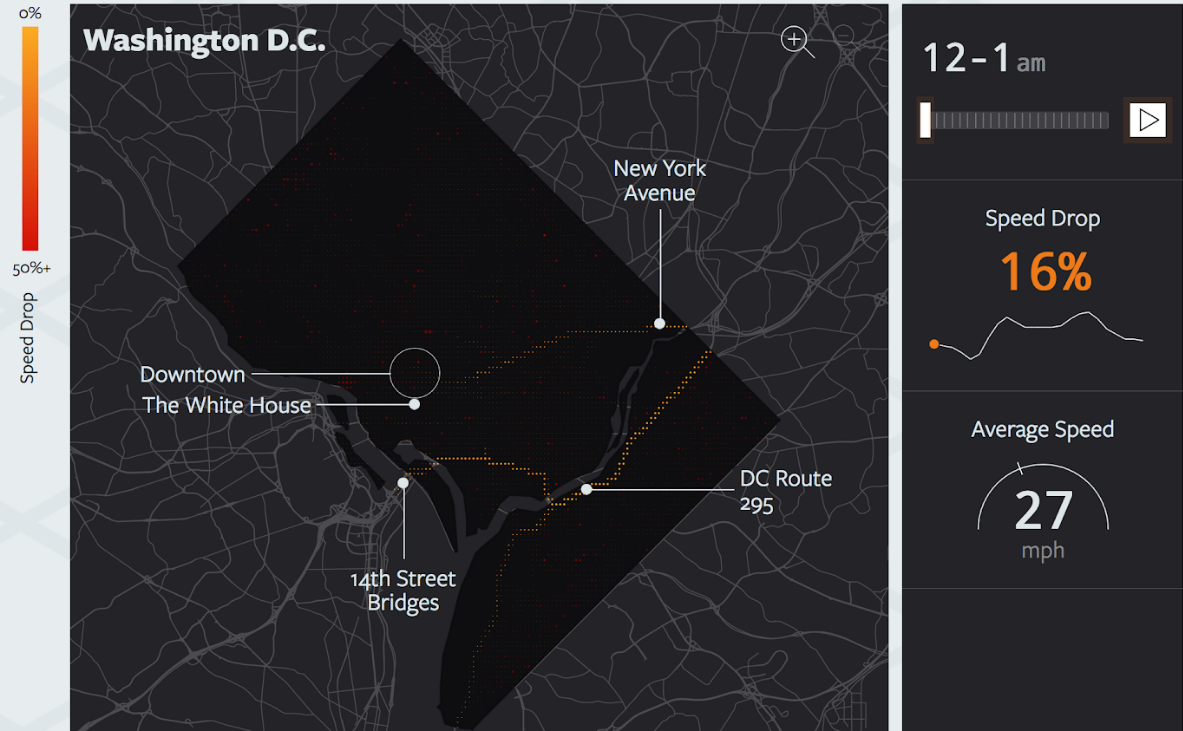
The interactive map series from Geotab enables users to view traffic congestion via an hour-by-hour breakdown within each city, providing insight into peak and average speed as well as speed decreases, the total number of vehicles on the road and peak hours for congestion. The Gridlocked Cities maps were created using 7.7 million aggregated traffic data records collected over the course of a year by Geotab GO devices in vehicles across the United States.
“Most drivers know when and where they’re likely to get caught in traffic in their area, but these maps allow users to explore the true scale of congestion across America,” says Mike Branch, Geotab’s VP of Data and Analytics.
Geotab data found that congestion hit all but one of the 20 cities the hardest in the afternoon and early evening, peaking at either 4-5 p.m. or 5-6 p.m. Baltimore was the sole exception, with roads slowing most significantly during the morning rush hour at 8-9 a.m.
On the contrary, the data depicts that Boston road users suffered the most significant drop in speeds across all 20 cities. At the city’s most congested time of day (4-5 p.m.), speeds fell 40% (relative to each location’s most free-flowing hour) down to an average of 22 mph. Similarly, New York is the second most congested city as traffic speeds dropped 38% to 22 mph at 5-6 p.m.
Those on the roads in St. Louis faced the fewest problems in terms of sluggish traffic with a speed decrease of 16% to 41 mph at the city’s most congested hour (4-5 p.m.).
Additionally, Geotab’s data also reported that Washington D.C. is home to the slowest-moving traffic overall, with speeds ranging from 19 mph at 5-6 p.m. to a maximum of 33 mph at 4-5 a.m.
“Around half of all congestion is recurring and reflects an overburdened infrastructure and lack of capacity on the road,” added Branch. “In addition to this, environmental, mechanical and human factors also contribute to congestion.
“Providing insight into traffic patterns can help to empower not only drivers but cities committed to improving roadways and their communites.”
More here: https://www.geotab.com/gridloc
Category: Connected Fleet News, General Update, News
Subscribe
If you enjoyed this article, subscribe to receive more just like it.


