


Spot Market Rates Near All-Time Highs in August
DAT Truckload Volume Index reports volatility in shipper networks due to shifting consumer purchasing spilled over to the spot market
Spot truckload rates neared all-time highs in August, according to DAT Freight & Analytics, which operates the industry’s largest online marketplace for freight on the spot market. Spot van, refrigerated (“reefer”) and flatbed rates were higher month over month and load-to-truck ratios increased across all three equipment types.
The DAT Truckload Volume Index, a measure of dry van, reefer and flatbed loads moved by truckload carriers, rose 1.1 percent from last month and is 0.8 percent higher than August 2019.
“Volatility in shipper networks due to shifting consumer purchasing spilled over to the spot market. For instance, commercial food service is way down, but grocery purchases are up,” said Ken Adamo, Chief of Analytics at DAT. “Asset-based carriers continued to honor their committed volumes but didn’t necessarily provide additional surge capacity. As a result, the number of available loads increased and prices rose to attract additional capacity.”
Van freight on an atypical path
Nationally, the August load-to-truck ratio for vans rose for the fourth straight month to 5.3, meaning there were 5.3 available loads for every available truck on the DAT network. The van load-to-truck ratio was 20 percent higher compared to July and more than double the ratio in August 2019 (2.3).
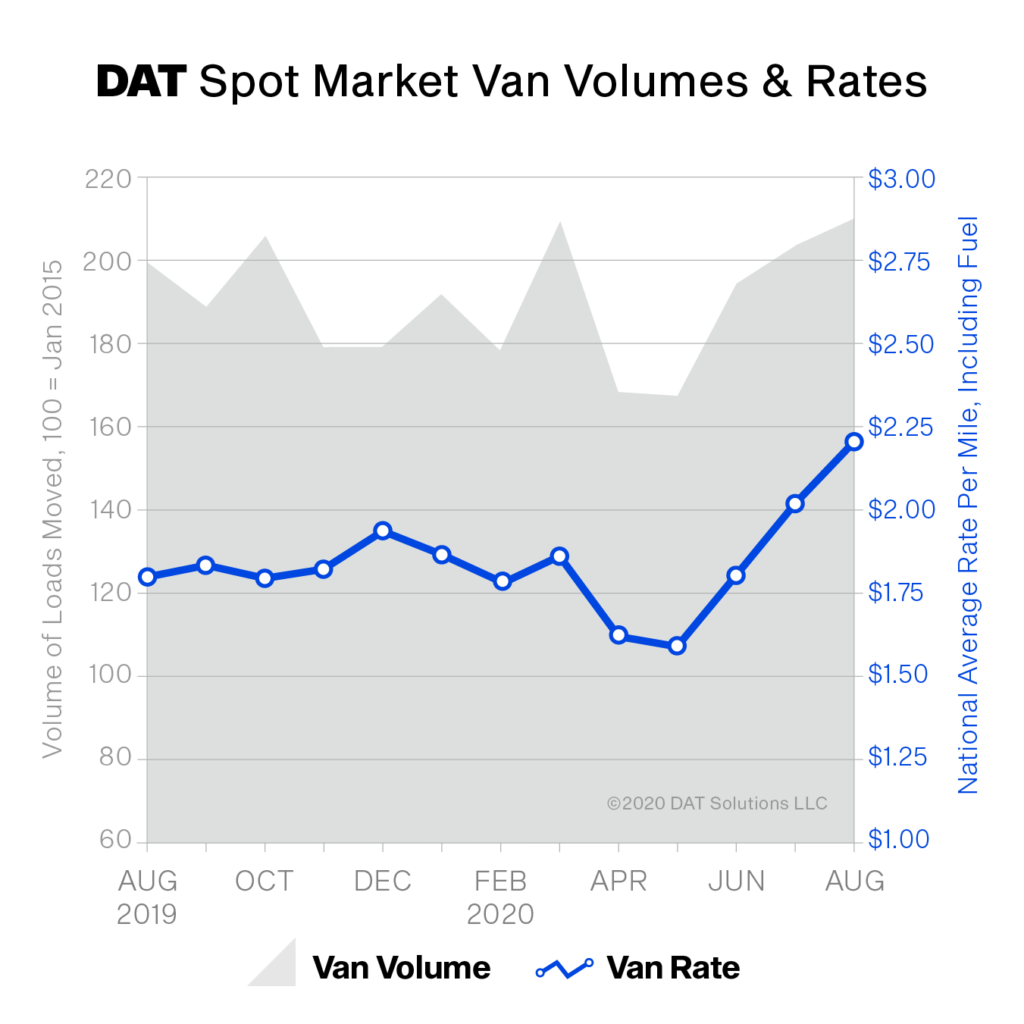
The spot van rate averaged $2.22 per mile nationally in August, up 19 cents compared to July and 41 cents higher compared to August 2019. At $2.02 per mile, the average spot line-haul rate for vans (the total rate minus fuel surcharges) was the highest monthly national average on record and exceeded the national monthly average contract rate for the first time since January 2018.
What’s different about 2020 is the rollercoaster ride spot van rates have been on during the pandemic.
Typically, freight rates begin the year on a predictably downward slope and then rise to a peak in June and July. But in 2020, by the end of March, spot van rates had jumped 15 cents per mile year over year only to drop 15 cents per mile below 2019 levels by May 1, a 30-cents-per-mile swing in just four weeks.
Since then rates have increased 62 cents per mile in just five months in what’s regarded as the longest continuous rate rally in the last five years.
Reefer, flatbed volumes fall
Spot reefer volumes were down 5 percent month over month. The national average reefer load-to-truck ratio was 9.3 in August, more than five times higher than April’s record low of 1.7 loads per truck. The national average reefer spot rate was $2.44 per mile, up 14 cents compared to July, and 30 cents higher year-over-year.
The national flatbed load-to-truck ratio averaged 31.5 in August, its highest point since July 2018. August flatbed volumes were down 6.3 percent compared to July and fell 16.4 percent compared to August 2019. The national average flatbed spot rate was $2.30 per mile, 10 cents more than July and 11 cents higher than August 2019.
DAT Freight Outlook
– Weather and wildfires are likely to have an impact on supply chains in the near term, disrupting regular freight networks and creating a higher rate environment due to constraints on capacity. Hurricanes can lead to a tightening of flatbed capacity as machinery and building supplies are needed for recovery efforts.
– Tight intermodal capacity and substantial rail surcharges at West Coast ports may force smaller shippers to consider switching to long-haul truckload carriers, especially out of Los Angeles and Long Beach. This would put further strain on spot market van capacity.
Category: Featured, General Update, Management, News
Subscribe
If you enjoyed this article, subscribe to receive more just like it.


