


Spot Truckload Freight Volumes Rebound 93% After Thanksgiving
DAT Trendlines, week ending Dec. 6
DAT Freight & Analytics
Spot truckload freight volumes rebound after Thanksgiving
Truckload volumes bounced back after Thanksgiving as the number of available loads increased 93% during the week ending Dec. 6, said DAT Freight & Analytics, which operates the industry’s largest online marketplace for spot truckload freight.
Big week-over-week swings are typical when you compare a full workweek to one with a major holiday. More telling is that there are nearly double the number of available loads on the DAT load board network compared to this time last year, while the number of trucks posted is down 9.7%.
While spot rates have been setting records, there are signs that pricing is beginning to soften for the first time in more than seven months.
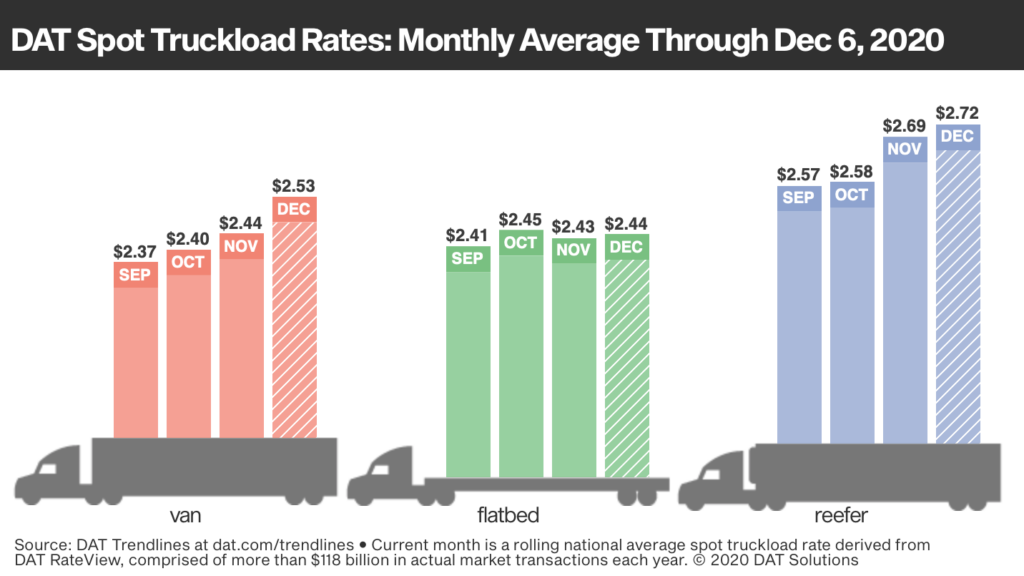
National Average Rates, December
Spot rates held up well last week compared to the November averages:
• Van: $2.52 per mile, 8 cents higher than November
• Refrigerated: $2.71 per mile, 2 cents more than November
• Flatbed: $2.43 per mile, the same as the November average
These are national average spot rates for the month through Dec. 6. These averages are based on actual transactions. DAT doesn’t set spot rates—each transaction is individually negotiated between the carrier and the broker or shipper and will vary from load to load and lane to lane.
Trendlines
Post-Thanksgiving lull. Rates and load movement dipped on DAT’s top 72 reefer lanes by volume. The average rate was higher on just 17 lanes, 54 lanes were down, and one was unchanged. Volumes on these lanes decreased 11% compared to the previous week, a sign that the reefer market may have hit the peak we expect to see around Thanksgiving.
The national average reefer load-to-truck ratio increased to 9.0, up from 6.3 the previous week.
Load-to-truck ratios represent the number of loads for every truck posted on DAT load boards. The load-to-truck ratio is a real-time indicator of the balance between spot market demand and capacity, and changes often signal impending changes in rates.
On the spot market, reefer load post volumes are up 53% year over year. However, the total volume of reefer freight is lower year over year largely because of the depressed food services sector. According to last week’s U.S. Dept. of Agriculture data, domestic loads of produce (which account for 53% of total produce volume) are down 18% year over year.
Van movements reflect retail changes. Dry van load postings spiked to a five-year high last week, up 21% compared to the weekly average for the prior two months. Capacity dipped, with 8% fewer trucks posted compared to the weekly average for all of October and November.
The national average van load-to-truck ratio was 5.9, up from 3.8 the previous week and well ahead of the November average of 4.5.
The number of loads moved in DAT’s top 100 van lanes by volume increased 6.7% compared to the previous week and the average outbound spot rate was higher on 53 of those lanes. Twenty-five lanes were neutral and 22 saw rates fall.
One surprise: Los Angeles and Ontario, Calif., have been among the top three van markets for volume during most of October and November but fell out of the top 10 last week. Capacity has been tight in southern California following the surge in imports on the transpacific shipping lane from Asia, driving up spot rates. But last week the supply/demand balance shifted and outbound rates fell in both markets.
Flatbed demand declines slightly. Of DAT’s top 78 flatbed markets, the average outbound rate was higher in 25, lower in 23, and neutral in 30 last week, and the number of loads moved in those markets declined by 3.6%. Rates in most high-volume markets have been flat over the last two weeks although several stand out for their ups and downs since Nov. 20:
– Jacksonville, Fla.: $2.64 a mile, up 20 cents
– Raleigh, N.C.: $2.68, up 9 cents
– Rockford, Ill.: $3.19, down 12 cents
– Harrisburg, Pa.: $3.64, down 9 cents
– Roanoke, Va.: $3.18, down 9 cents
The flatbed load-to-truck ratio was 35.8 as a national average, up from 24.9 the previous week.
DAT operates the industry’s largest network of load boards and freight data analytics service. Rates are derived from DAT RateView, a database of $68 billion in actual spot market transactions each year. DAT monitors an additional $50 billion in contract freight transactions for subscribers to its Freight Market Intelligence Consortium (FMIC).
Spot market transactions are individually negotiated between the carrier and the broker or shipper and will vary from load to load and lane to lane. DAT does not set spot rates.
Category: Driver Stuff, Featured, Fleet Tracking, General Update, News
Subscribe
If you enjoyed this article, subscribe to receive more just like it.