


Tenstreet Q3 Market Index: Recruitment & Retention Rundown

Tenstreet roundup of industry data for Q3 indicates an especially strong rebound from the unpredictability of the pandemic years – as well as the usual seasonal signals that recruiting is headed for a holiday slowdown
Recruiting: State of the Market
The 2022 Recent Driver Market Activity graphs below tell the overall story of driver applicant and application behavior for 2022, starting in July and continuing to the end of October.
The Leads Drivers and IA Drivers chart depicts the number of drivers filling out lead forms (Leads Drivers) and the number of drivers submitting IntelliApps (IA Drivers) each week.
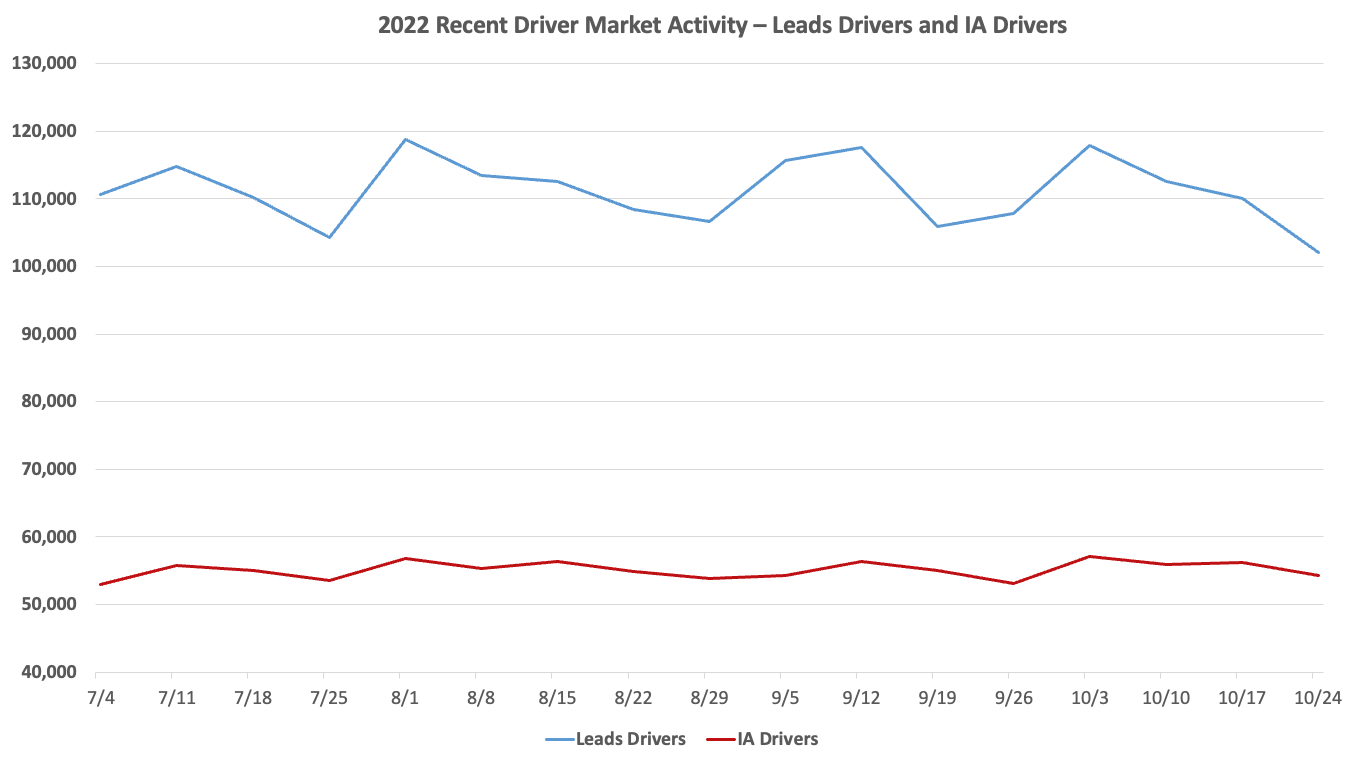
The start of October marks the beginning of a downturn of drivers submitting leads that we’re likely to see through the end of the year. We observed last quarter that lead submissions were fluctuating seasonally around major holidays but that IntelliApps were seeing a slow and steady climb. This quarter, drivers submitting leads and IntelliApps are trending together, with numbers on both sides declining.
Drivers submitting leads hit several high points the weeks of 8/1, 9/12, and 10/3, but the steady decline since the first week of October will likely either plateau or keep falling as November continues. The downward tilt of IntelliApp submissions since a peak of 57,000 in the first week of October still keeps the number of apps submitted within the normal range, but we suspect this slight decline will continue.
This behavior is well in line with seasonal trends we’re used to seeing as the holidays approach. Drivers don’t want to be new at a carrier around the holidays and miss out on important home time, or risk being laid off as a result of last-in-first-out policies that might make them vulnerable if a carrier’s needs fluctuate during November and December.
This is a pattern we usually see becoming more pronounced with each passing week through the end of the year, so carriers who need to fill trucks now should do everything they can to accelerate their efforts in the weeks leading up to Thanksgiving.
The Leads and IntelliApps chart depicts the number of lead forms submitted (Leads) and the number of IntelliApps submitted (IAs) each week.

Much like the trajectories depicted in the Leads Drivers and IA Drivers chart, the number of completed applications is drifting downward (though staying within normal ranges) and the number of leads is taking a sharper plummet, dropping from 319,000 leads the week of 10/3 to 285,000 leads the week of 10/24.
While both of these charts suggest a seasonal trend we’ve come to expect, it’s also important to note how these charts have changed in a larger sense since our last index. The number of IntelliApp drivers drifted around an average of 45,000 for the first half of the year, cracking the 50,000 driver mark for the first time in June. Ever since, the average number of IntelliApp drivers has floated around 55,000 each week, meaning that the market as a whole is seeing an additional 10,000 driver applications a week on average, even accounting for seasonal trends. Similarly, the Leads Drivers number hasn’t fallen below 100,000 a week since late June.
What these quarterly and yearlong trends tell us is that the driver market has made a sturdier recovery that indicates a high level of market health overall. This suggests we are finally stabilizing from the long-tail effects of the pandemic, with drivers less cautious of trying to find a better position at a different carrier, and have a better sense of the level of market participation we can expect to come. The continued pressure of inflation and a national recession are likely factors as well, inducing drivers to seek better pay and opportunities when everyone’s dollars aren’t going as far.
The Job Store Advertising Effect
The Bring Your Own Apps vs. Job Store Clients chart below shows the difference in application volume between clients who use our Job Store services to advertise their open positions and clients who don’t.
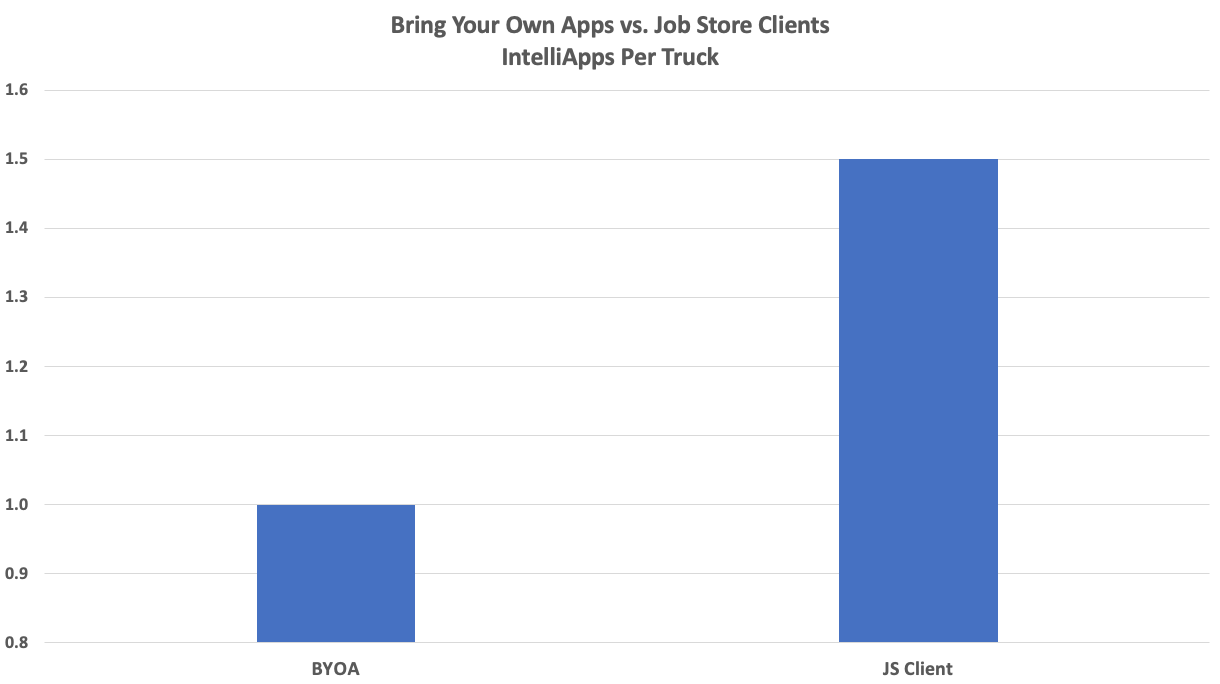
As the chart makes clear, clients using Job Store see roughly 50% more applications per open position than clients who use their own advertising. This is likely because drivers applying to companies using Job Store have the option to upgrade a lead form to a full application, making it easy to apply and decreasing the friction of a lengthy application process.
This is a hugely significant additional volume that means recruiters who use Job Store have far more candidates to choose between – meaning they’re much more likely to be able to make a quality hire when drivers in the market are scarcer as the year winds down. Integrating Job Store advertising is an easy win going into Q4.
Retention: Turnover in Trucking Outlook
Displayed below are our quarterly Stay Days Table and Turnover reports, which highlight the trends we’ve been seeing in driver retention behavior once a driver is hired at a carrier.
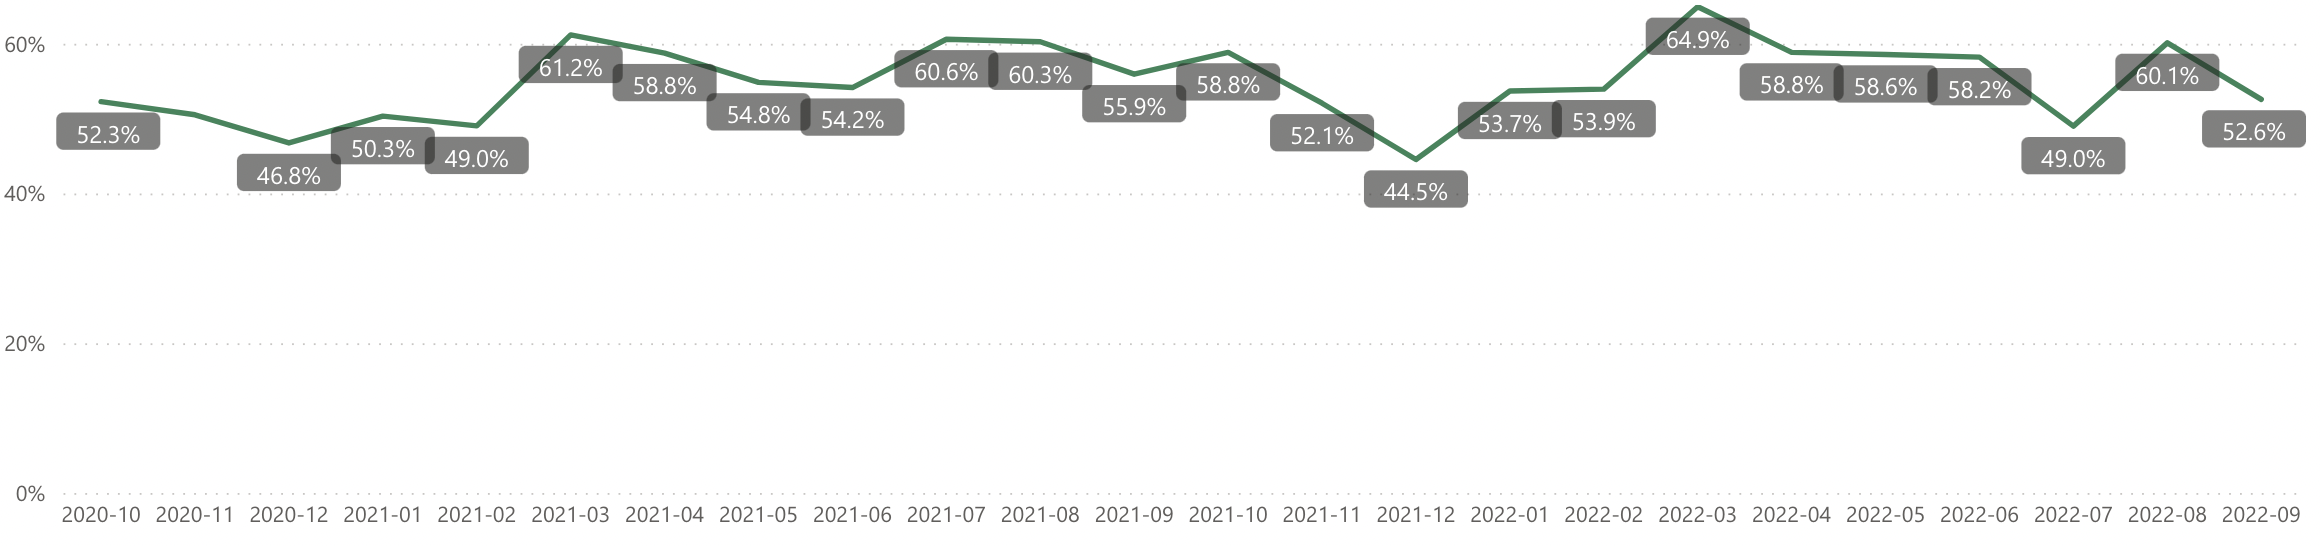
The Monthly & Quarterly Annualized Turnover charts provide detail into driver employment trends among carriers.
Monthly Annualized Driver Turnover
Quarterly Annualized Driver Turnover
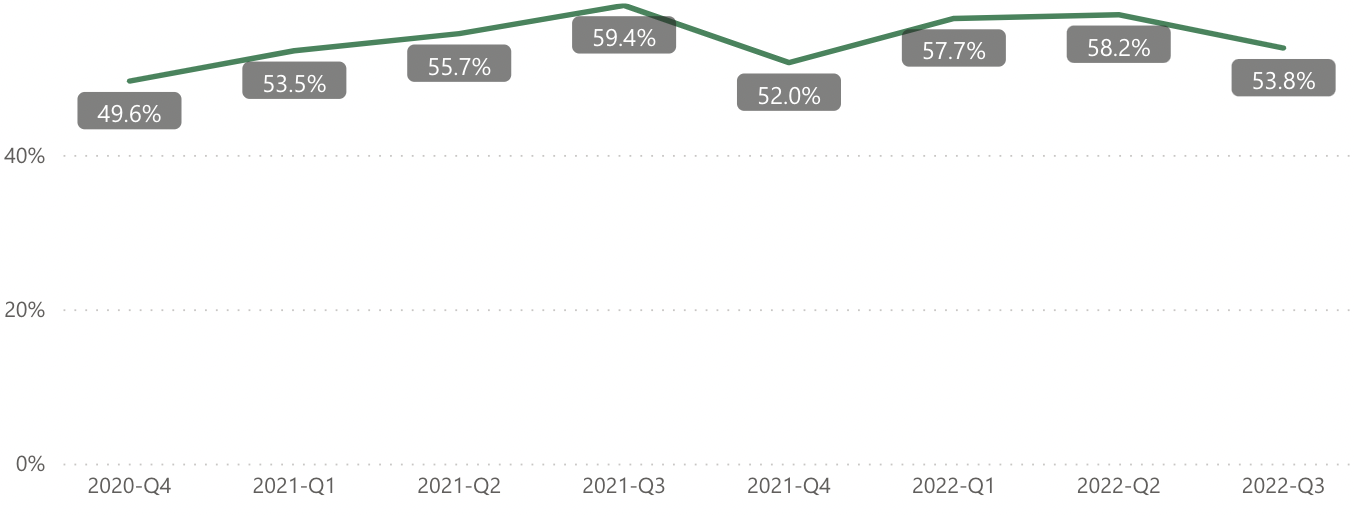
While an initial look at monthly annualized driver turnover shows variability in the last three months, summarizing the data by quarter shows that turnover trended downward in Q3. This is in contrast to Q3 2021, when turnover trended up, and then went sharply downward during Q4 and the holiday season. The decrease in turnover in Q3 could be an indicator that drivers are having recession-related concerns and are less likely to move to a new carrier, where they could be at the bottom of the list when miles may become scarce.
The Stay Days Table serves as a “survivor” chart tracking how long recently hired drivers are staying with their carriers.
Stay Days Table
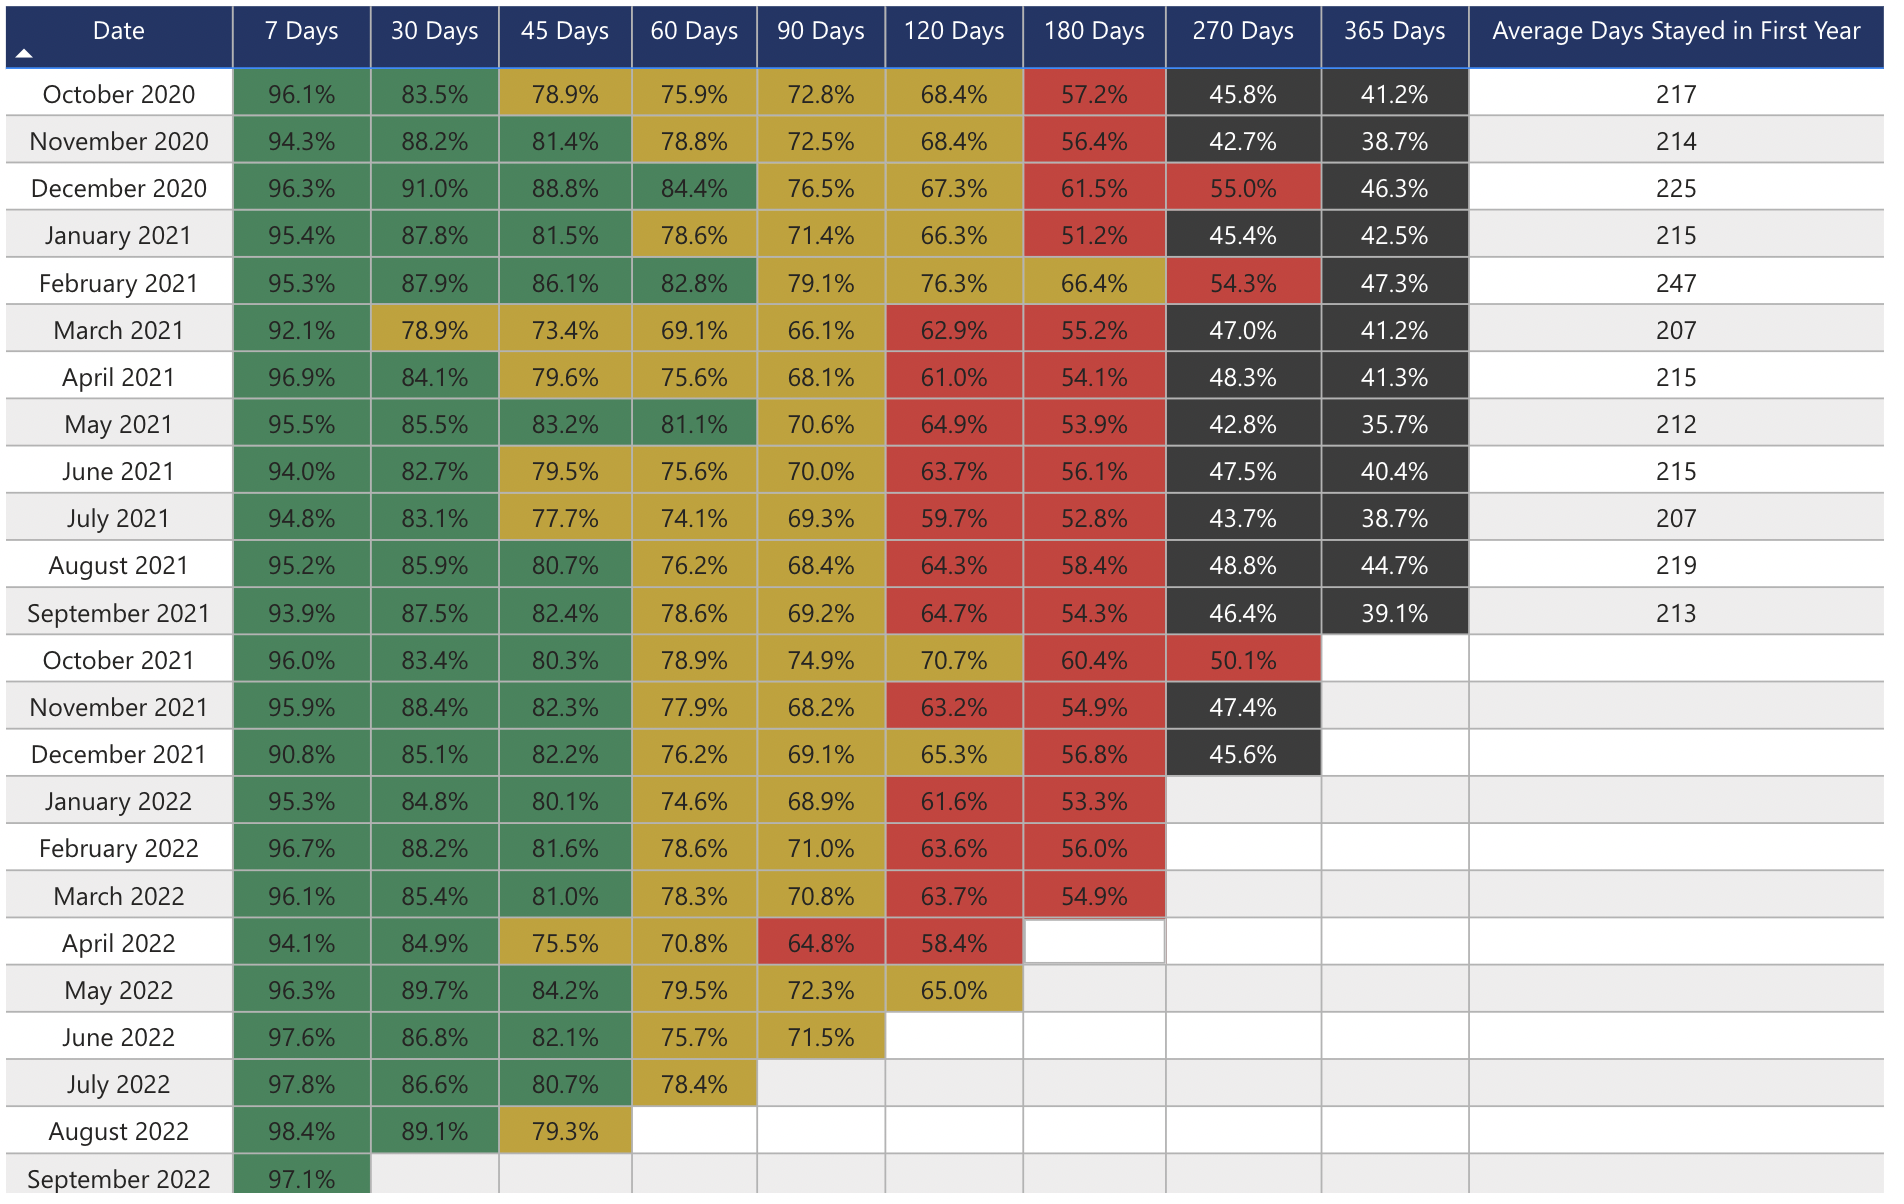
The short-term Stay Days Table numbers support this theory. For the most recent three months of data available, retention numbers are up year over year for the 7 and 30 day milestones, similarly suggesting that newly hired drivers are thinking it is best to hold on to their current jobs.
What Savvy Carriers can do to Improve
If fewer drivers are looking for jobs, you’ll need to make sure your current drivers are satisfied by making retention a higher priority. Tenstreet’s Insights platform features Interventions, a functionality that automatically flags drivers based on negative responses to surveys, and then assigns an employee to connect with that driver to listen to their concerns.
But recruiters shouldn’t sit out of the game entirely as the holidays approach. Marilyn Surber, Tenstreet’s Transportation Advisor, observed earlier in Q3 that “When it comes to recruiting, when you turn off your advertising or change what you are doing, it takes a long time to build it back up. The data is telling us not to do that right now.” Keeping your company’s name out there and being open to the drivers who do feel a need to change jobs will help carriers keep trucks filled, as well ask keeping them agile to hit the ground running when application volumes inevitably spike in January.
Byline:
BAILEY JAMES TENSTREET INDEX
Category: Driver Stuff, Featured, General Update, Management, News, People, Safety, Training
Subscribe
If you enjoyed this article, subscribe to receive more just like it.


