


Cass Transportation Index Report August 2022

Rate Relief Expected in 2023
In the U.S. trucking markets, the tight supply/demand balance has been easing considerably this year. This has freight rates topping out and set to slow sharply in the months to come.
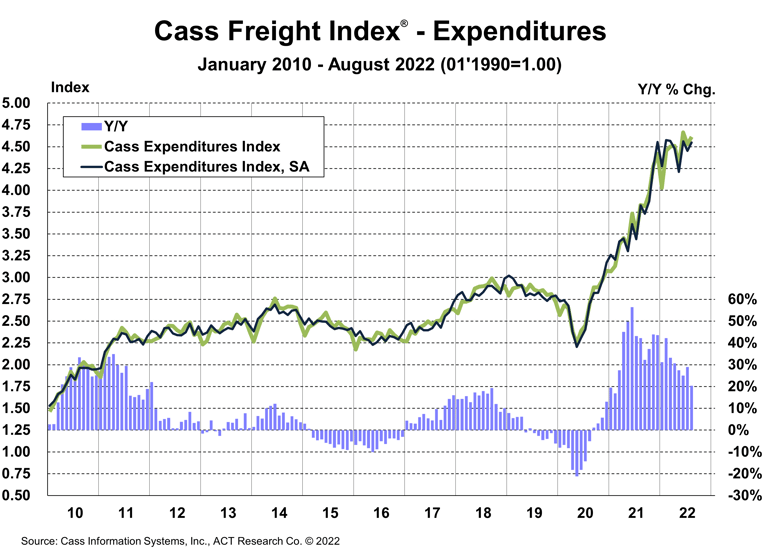
Cass Freight Index – Expenditures
The expenditures component of the Cass Freight Index®, which measures the total amount spent on freight, rose 1.9% m/m in August after a 3.0% decline in July, with shipments up 6.6% and rates down 4.4%.
The July index is revised to 4.527 from 4.499.
- The Cass Expenditures Index was still 20% higher than year-ago levels in August, decelerating from 29% in July.
- On an SA basis, expenditures rose 2.1% m/m in August, with shipments up 5.5% m/m and rates down 3.2%.
We estimate roughly 7pps-8pps of the y/y increase in the expenditures index is currently due to fuel prices alone, and part of the m/m decline in rates was due to lower fuel prices. This index includes changes in fuel, modal mix, intramodal mix, and accessorial charges.
Simply following normal seasonality from here, this index is on track for a 24% increase in 2022 and would turn down on a y/y basis next February.
Inferred Freight Rates
The freight rates embedded in the two components of the Cass Freight Index rose 16% y/y in August, decelerating quickly from the 26% y/y increase in July.
- Cass Inferred Freight Rates fell 4.4% m/m (-3.2% SA) in August. Lower fuel prices were a factor in the decline, but with looser truckload market conditions, further deceleration is very likely.
With the tight supply/demand balance in U.S. trucking markets easing considerably this year, industry rates are topping out and set to slow sharply in the months to come.
While shippers aren’t seeing any real savings yet, such relief is now highly probable for 2023, which is welcome news for the broader inflation picture.
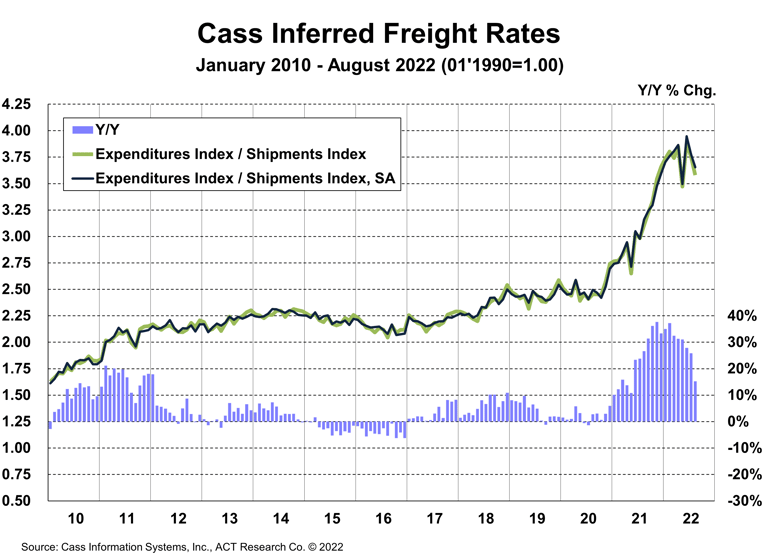
Cass Inferred Freight Rates are a simple calculation of the Cass Freight Index data, expenditures divided by shipments, producing a data set that explains the overall movement in cost per shipment. The data set is diversified among all modes, with truckload representing more than half of the dollars, followed by LTL, rail, parcel, and so on.
Truckload Linehaul Index
The Cass Truckload Linehaul Index® rose 7.4 y/y in August to 159.7, after rising 10.5% y/y in July.
- On a m/m basis, the Cass Truckload Linehaul Index fell 1.8%, similar to the declines in June and July. The clarity of the trend change in the past three months is rather stunning: after a 22-month cycle of increases that averaged 1.2% per month, the index fell m/m 1.76%, 1.78%, and 1.83% respectively in June, July, and August.
- We’ve consistently previewed this trend change, so it shouldn’t be a surprise, but the stunning part is the consistency in the three consecutive 1.8% declines—enough to make us look out to the hundredths of a percent.
- This index excludes fuel and accessorial charges, so when factoring in sequential declines in fuel surcharges, which should continue near term, the deceleration in freight costs is accelerating.
- Similar to what has occurred in the spot market, the surge in fuel costs to shippers, which are excluded from this index, will also likely act as a brake on linehaul rates.
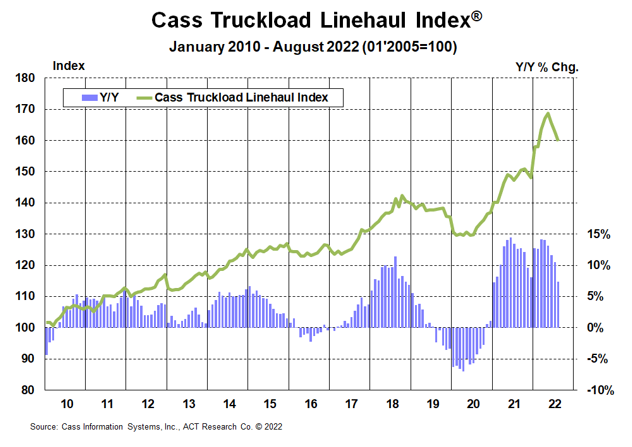
See the methodology for the Cass Truckload Linehaul Index.
Freight Expectations
Even with a summer volume uptick, freight markets are loose heading into peak season, largely due to the significant supply response which gained momentum this year.
During the active hurricane seasons of both 2020 and 2021 (June 1- November 30), the ACT Research composite of DAT spot rates, ex-fuel, rose 8% and 4%, respectively, into Labor Day. This year, spot rates fell about 6%, ex-fuel, amid the calmest hurricane season since 2013.
But there’s much more at work in the freight economy than the weather. The hurricane effect is considerable, and the season isn’t over, but we think the divergence between this year’s early September rate trend with the past two is mainly due to the looser market balance. The shipment rebound is, so far, not enough to outweigh the 4%-5% growth rates in the driver and Class 8 tractor populations presently. The story concludes in ACT Research’s monthly Freight Forecast.
Moreover, the looser market balance we see in U.S. freight markets is consistent with the easing happening in global ocean spot markets, where rates were 56% below year-ago levels in early September (see chart). The broader effects of these cost savings for shippers will show up more in 2023, so should gradually become more helpful to the Fed’s fight against inflation and for resolving supply chain issues. One interesting takeaway from the IANA intermodal conference in Long Beach this week is that there’s still a whole lot of inefficient freight jamming warehouses and slowing rail service.
The Cass Transportation Indexes accurately measure changes in North American freight activity and costs based on $37 billion in paid freight expenses for the Cass customer base of hundreds of large shippers. https://www.cassinfo.com/
Category: Connected Fleet News, Driver Stuff, Equipment, Featured, General Update, News, Transit News, Vehicles
Subscribe
If you enjoyed this article, subscribe to receive more just like it.


