


Delivery Companies Lose Nearly $6B Annually Due to Map Problems During Last-Mile Delivery
Mapillary reveals billions more lost due to extra miles, idle time, wages, missed delivery windows, and unnecessary parking tickets for the U.S. logistics sector
Mapillary, the street-level imagery platform that uses computer vision to scale and automate mapping, today announced the release of its first Mapping in Logistics Report which reveals the material impact of broken maps on the logistics sector. The report based on a survey conducted last month of last-mile delivery drivers, industry data and insights from industry experts, uncovered nearly $6B in costs associated with driving extra miles and wasted time alone, in addition to missed delivery windows, parking availability, and parking tickets all due to maps that lack accurate, up-to-date information related to navigation and traffic signs and building information such as entrances and parking slots. Of the delivery drivers surveyed, nearly all (99%) said they would be more effective if they had better maps.
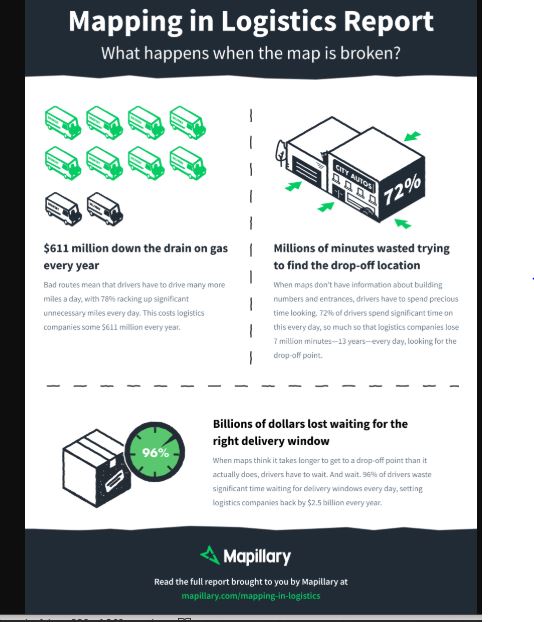
The report estimates the industry is racking up $2.5 billion in wasted salary alone and $611 million in extra miles due to drivers not having better maps. A third of drivers stated they could save upwards of five hours each week if they had access to detailed and up-to-date maps, saving companies $2.6 billion annually.
“We know intuitively that broken maps waste time and money for logistics companies, and with the Mapping in Logistics Report we now have data to begin calculating just how massive the problem is,” said Jan Erik Solem, Mapillary co-founder and CEO. “The growing demand for ever-shrinking delivery times has created tremendous pressure on maps being more detailed and up-to-date and, as we see in the report, broken maps create inefficiencies across the board. Better maps will result in more deliveries at a faster pace every single day, saving millions of dollars each year for individual companies and dramatically improving their bottom lines.”
The report revealed striking inefficiencies including:
- Extra driving miles – 78% of surveyed drivers report driving more than 5 extra miles a day due to bad routes (closed roads, bad signage, etc.), with 22% reporting between 15 and 25 extra miles and 11% reporting between 25 and 50 miles.
- Exact drop-off location – 72% report taking more than 4 minutes to find the exact location (building numbers, delivery entrances, etc.) for a typical delivery, with 36% taking more than 7 minutes and 14% taking more than 10 minutes.
- Delivery windows – 96% report wasting significant time during the day waiting for delivery windows, with 76% wasting more than 15 minutes and 35% wasting more than 30 minutes.
- Parking availability – 62% report taking more than 4 minutes to find parking, with 32% taking more than 7 minutes and 10% taking more than 10 minutes.
- Parking tickets – 57% report getting multiple parking tickets per month, with 33% getting more than 8 tickets.
- Undelivered packages – 86% report taking packages back as undeliverable, with 38% taking back more than 25 packages per week.
The Challenges of Maps
Maps include company-provided delivery management devices, Google maps or Apple maps on a smartphone or tablet, and built-in vehicle navigation systems. The Mapping in Logistics Report revealed that drivers had the following challenges with their maps:
- 99% of delivery drivers say they would be more effective if they had better maps.
- 95% report problems with maps, including longer routes, long distances from actual drop-off locations, and road closures.
- 38% report issues with maps every day they work, with 12% reporting issues with every delivery.
- 50% report that a problem with a map during a single delivery delays deliveries for the rest of the day.
- 92% say maps have significant room for improvement.
“Consumer demands around online shopping and delivery times are evolving rapidly, and major players like Amazon, Best Buy, and Walmart are now providing same-day delivery in numerous locations across the U.S. This puts pressure on every logistics company to utilize accurate, up-to-date maps that can ensure faster last-mile delivery and an optimal customer experience,” Solem added.
Methodology
The survey was conducted by Dimensional Research in December 2019 and completed in January 2020. The 219 individuals surveyed all worked as delivery drivers in the U.S. and were responsible for delivering packages to homes and businesses and used mapping applications for their work. Delivery vehicles included cars and trucks, and locations included a mix of businesses and residences.
For the cost estimations presented in this release, the following assumptions have been made.
- 1,449,100 is the total estimated number of delivery drivers in the US (BLS)
- $14.66 is the median hourly pay for delivery drivers (BLS)
- $2.877 is the average cost per gallon of gas in the U.S. (GlobalPetrolPrices)
- 24.9 mpg is the average fuel consumption of vehicles in the U.S. (EPA
Category: Connected Fleet News, Driver Stuff, Featured, Fleet Tracking, General Update, News
Subscribe
If you enjoyed this article, subscribe to receive more just like it.


