


Tenstreet Q2 Market Index: Recruitment & Retention Rundown

These new findings related to recruiting and retention can help carriers keep drivers in their trucks for the long haul
We’re always prepared for unexpected changes when it comes to the trucking industry – so many outside factors can affect how a carrier operates and what its finances look like. But Q2 of 2022 has been particularly unpredictable, presenting new challenges for companies trying to keep operations steady.
Our roundup of industry data this quarter indicates some unexpected trends carriers should pay attention to, especially around driver behaviors. Read on to learn more about what you should be prioritizing this quarter.
Recruiting: State of the Market
The YTD Driver Market Activity graphs below tell the overall story of driver applicant and application behavior for 2022 through mid-July.
The Leads Drivers and IA Drivers chart depicts the number of drivers filling out lead forms (Leads Drivers) and the number of drivers submitting IntelliApps (IA Drivers) each week.
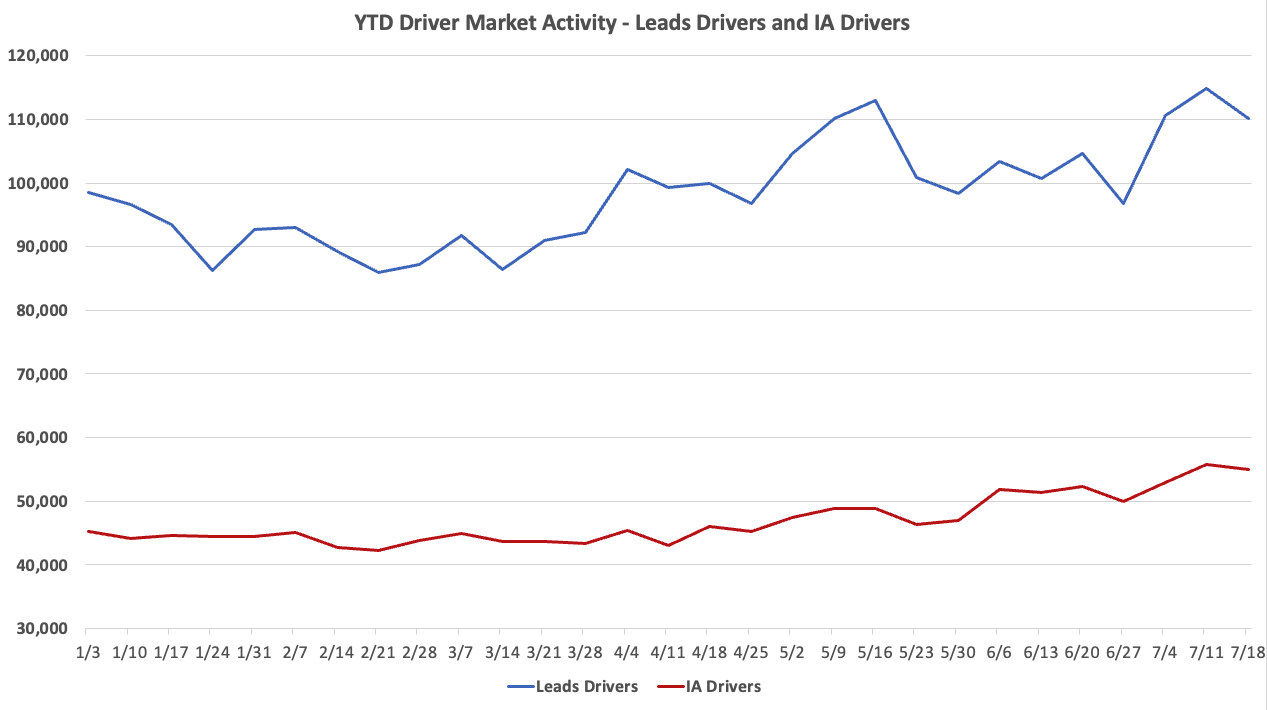
In our last market index, we noted an extremely stable trend in the number of drivers submitting IntelliApps week-over-week from January through April of 2022. This quarter tells a different story: the number of drivers filling out full IntelliApps began snaking upward in May and climbed even more aggressively in June, leading to a peak of more than 55,000 drivers submitting applications the week of July 11th – 10,000 more drivers than we saw on average for the first quarter of 2022.
This increase in drivers submitting IntelliApps doesn’t correspond neatly with an increase in drivers submitting leads, though. Drivers filling out leads has an ebb and flow that corresponds with more seasonal factors, like a summer slowdown, including a dip in interest right before the 4th of July. This is consistent with the idea of drivers filling out leads in a more exploratory fashion and then losing interest in making a major shift during big holidays.
We are also seeing a spike in drivers filling out leads, with a peak number of drivers (nearly 115,000) submitting a lead form the week of July 11th. Since the start of May, the number of leads week-over-week has been consistently higher than the number of leads submitted at the start of January, one of the most popular times to consider searching for new jobs. Interest in job changes, both idle and serious, is at an all time high.
The Leads and IntelliApps chart depicts the number of lead forms submitted (Leads) and the number of IntelliApps submitted (IAs) each week.
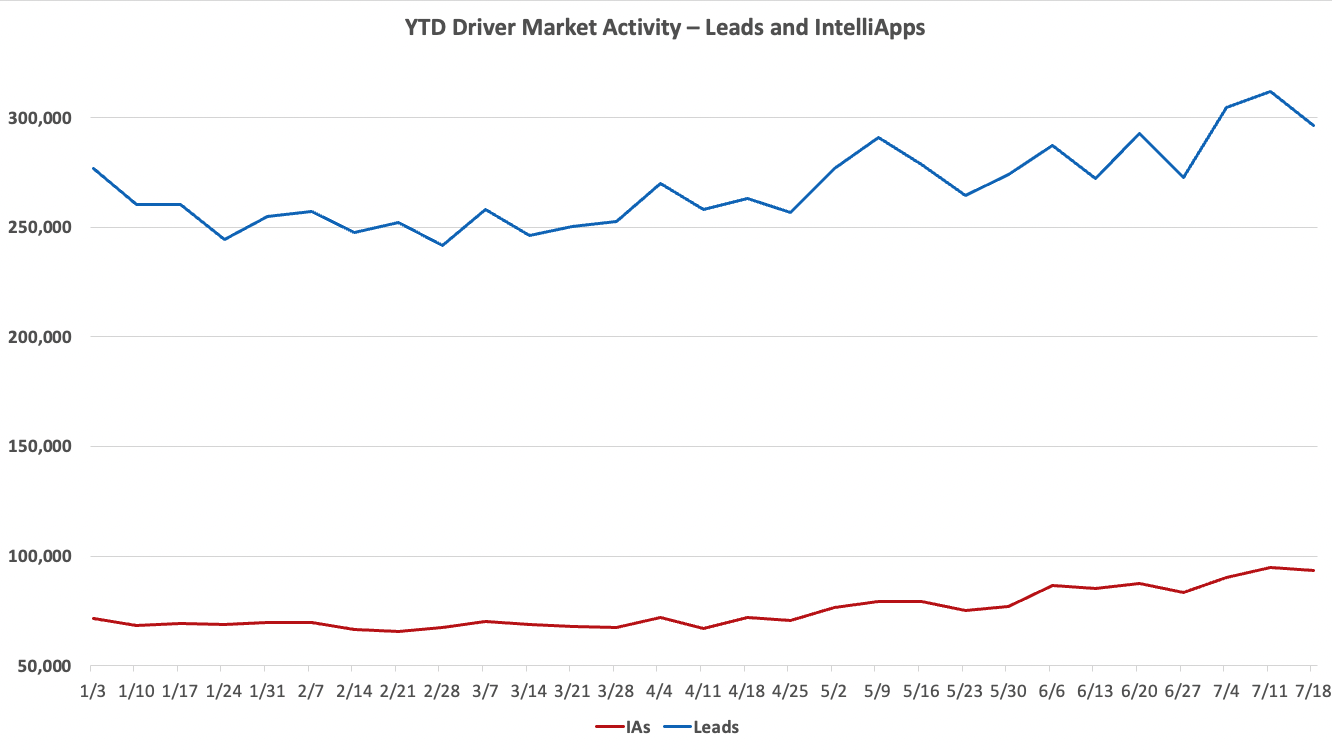
Similar to the trends reflected in the first chart, the number of completed applications began to soar shortly after our last index. In the first 4 months of the year, between 66,000 and 72,000 full IntelliApps were being submitted a week. Starting in May, that number climbed to 76,000 and kept rising, hitting a peak of more than 94,000 apps submitted the week of July 11th. Leads are peaking too, with the number of leads submitted in a week breaking the 300,000 mark for the first two weeks of July.
What can we conclude from both of these charts? The biggest takeaway is that the number of drivers with a more serious interest in a job change – enough to fill out and submit a full IntelliApp – is steadily climbing. This trend, which goes against more seasonal patterns we’re used to seeing, suggests new factors are at play. This could be attributed to the recession-like conditions we’ve been experiencing all through 2022. Drivers are more serious about finding new positions, which puts carriers at an advantage when hiring.
Candidate Application Patterns
The Candidate Application Patterns chart below dives even deeper into driver behavior when applying for jobs over the past 14 months.
The left axis maps to the bar graphs showing the total number of candidates in the market and the total number of full applications they’ve filled out each month. The gray line maps to the right axis and shows the percentage of candidates in the market who are completing full applications.
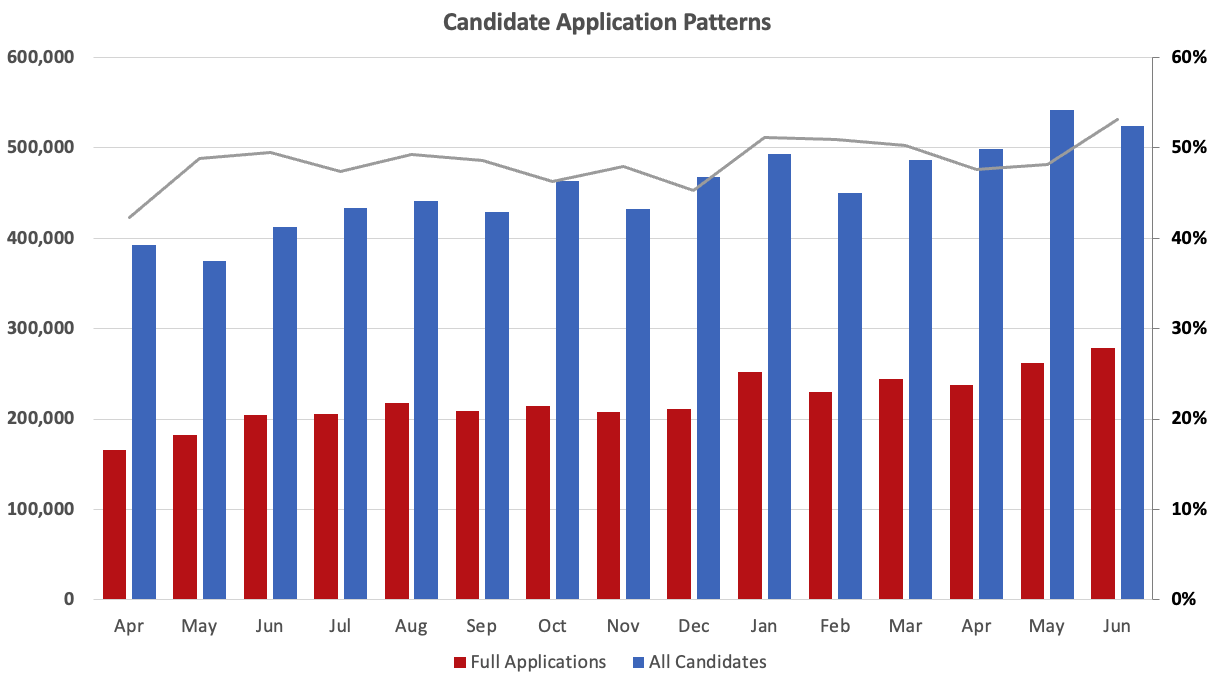
With completion percentages staying relatively stable (either slightly over or slightly under 50% for all of 2022), this solidifies that more drivers are filling out more applications than we’ve seen in quite awhile. That’s great news if you’re hiring since you’ll likely have a larger selection of applicants to choose from, but not so great if your current drivers are among that pool of hopefuls seeking a new position. We imagine these higher applicant levels will stay fairly steady throughout Q3.
Tenstreet’s Driver Pulse Effectiveness Rates
With all these trends toward more drivers entering the hiring market, savvy carriers are likely considering what they can do to get drivers’ attention. We’ve found a compelling solution in the popularity and success of Driver Pulse Messaging.
In the Pulse as Effective Recruiting Tool chart below, the left axis measures the effectiveness of each communication method, both in engaging a candidate and in resulting in a hire.
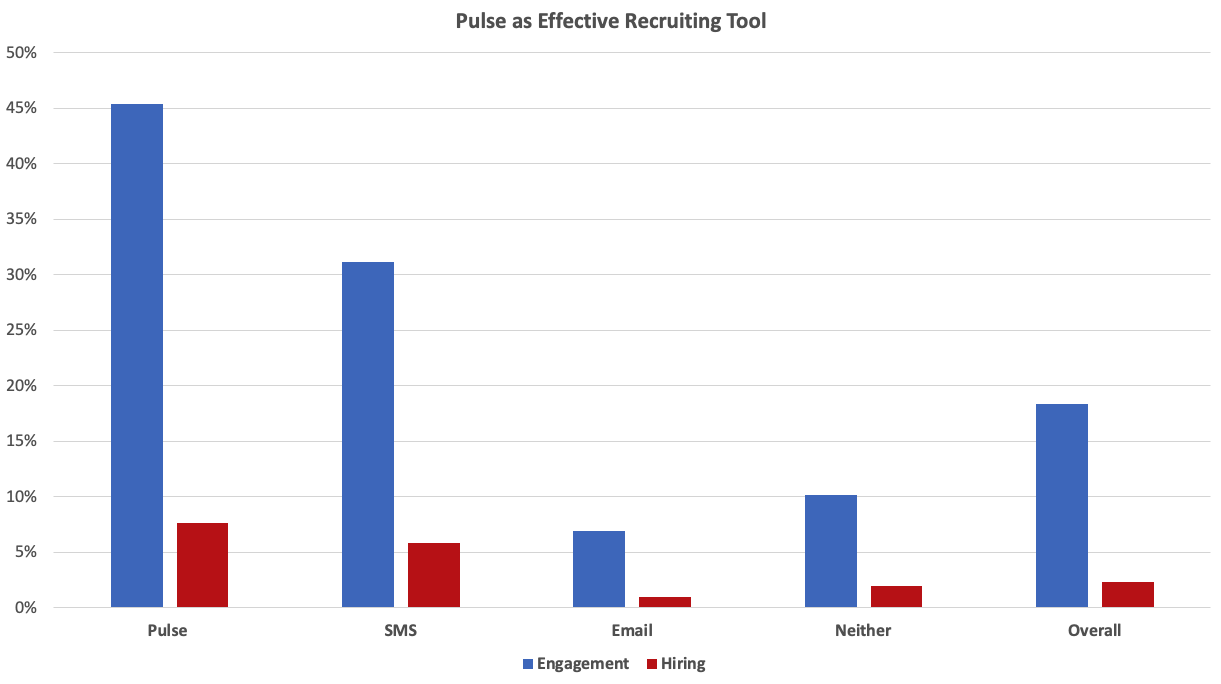
As we’ve documented before, Pulse messaging is a far more successful tool for communicating with drivers than SMS texting or emailing. As the chart shows, reaching drivers through Pulse has a 45% success rate at engaging drivers, resulting in an overall hire rate of 7.6%. Compare this to the 5.8% hire rate on SMS texts and the 1% return on emailing and Pulse stands head and shoulders above as a way to address driver questions, request documents, and more.
The reason Pulse messaging is so effective is because it happens inside the app where drivers are already filling out applications, uploading documents, and managing their careers. By interacting with them inside a place free of the personal distractions that texts and emails bring, your chance of keeping a driver engaged through the hiring process expands considerably.
Retention: Turnover in Trucking Outlook
Displayed below are our quarterly Stay Days Table and Turnover reports, which highlight the trends we’ve been seeing in driver retention behavior once a driver is hired at a carrier.
The Monthly Annualized Driver Turnover chart provides detail into driver employment trends among carriers.
Monthly Annualized Driver Turnover
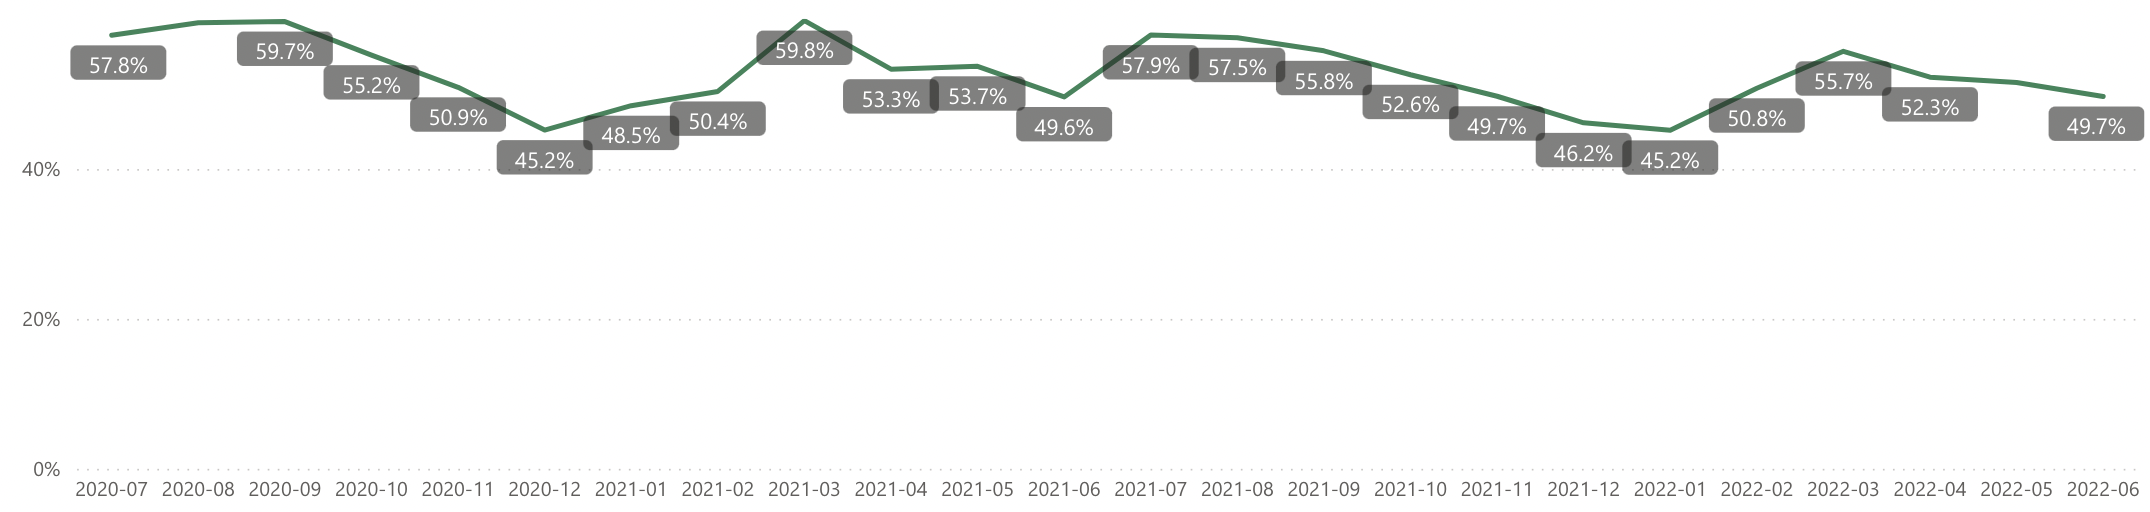
The data from the Turnover graph shows seasonal trends. When comparing January-June 2022 to January-June 2021, similar patterns can be seen in a peak turnover rate in March, followed by a downward trend through June. If these seasonal trends continue, carriers could expect turnover to increase again in July, similar to 2021.
The Stay Days Table
The Stay Days Table serves as a “survivor” chart tracking how long recently hired drivers are staying with their carriers.
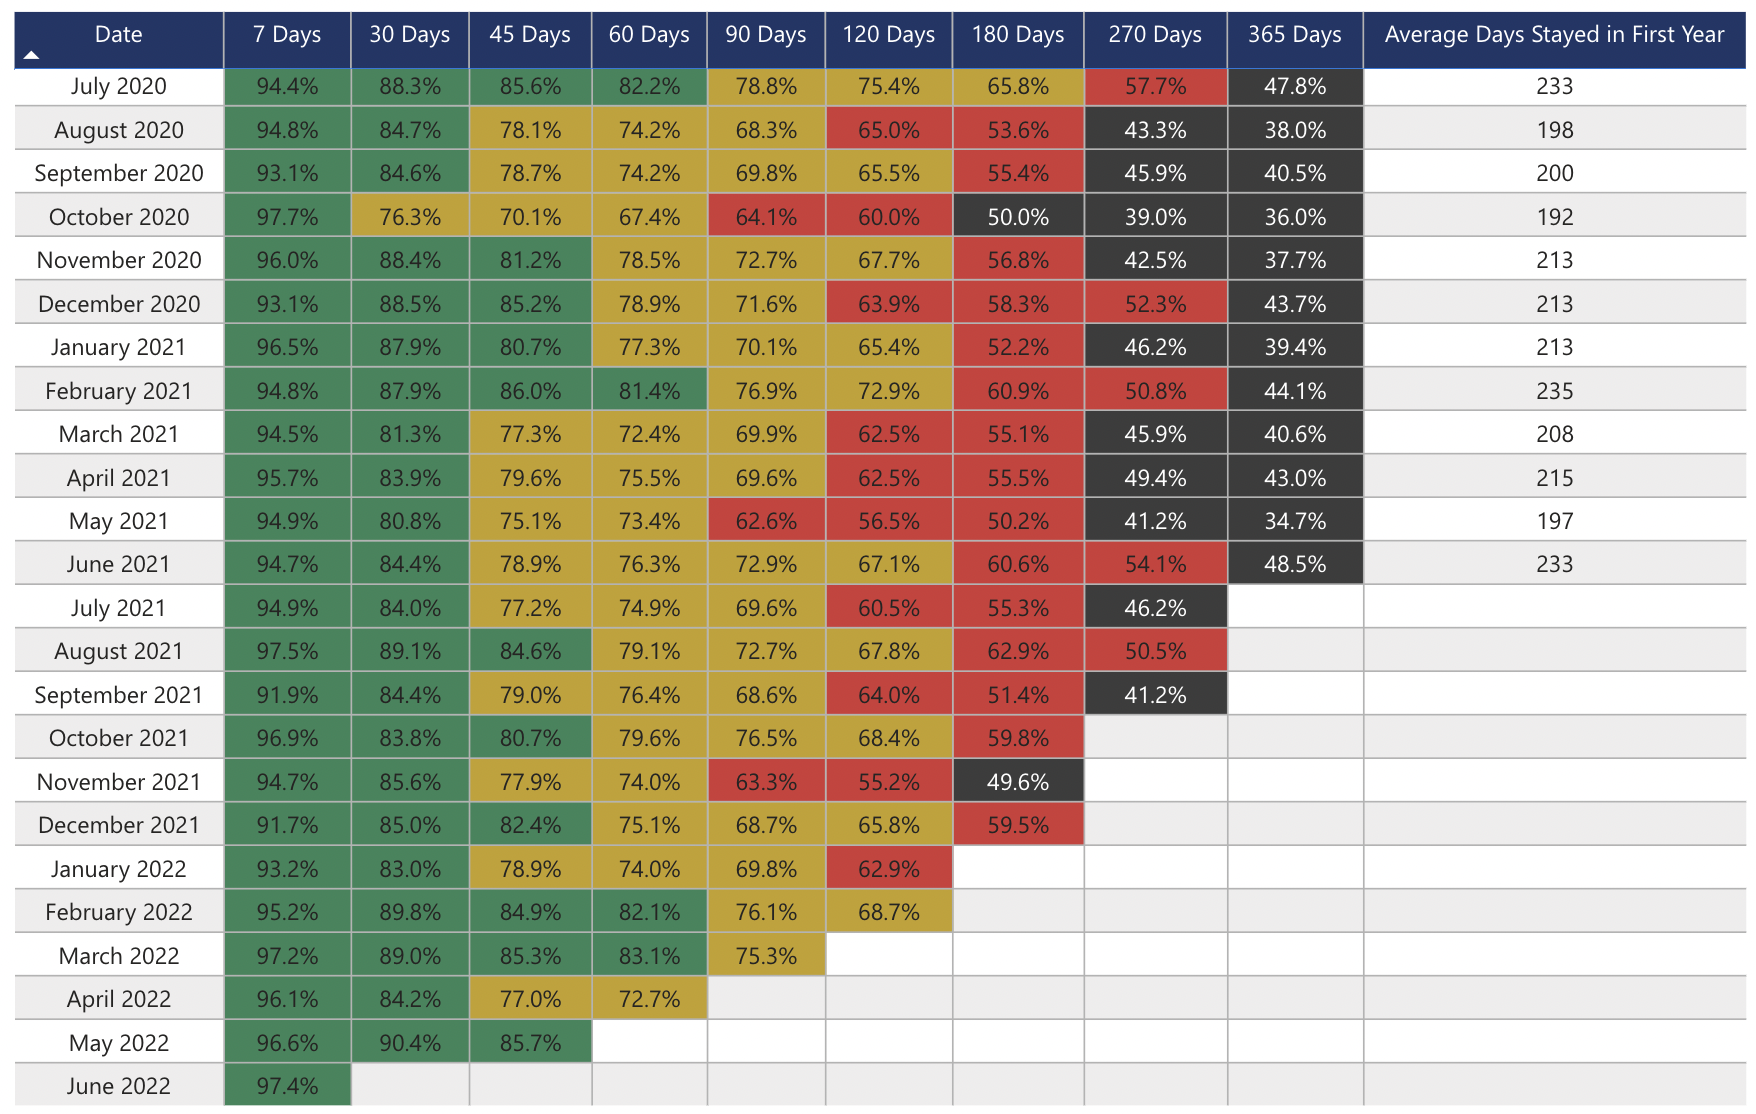
The market for newly hired drivers seems to be more unstable recently. The last two months of data for drivers staying 365 days has both the highest percentage for that timeframe on the chart (48.5%) and the lowest (34.7%). Similarly, the percentage of drivers staying 180 days has oscillated in the last three months, dropping by over 10 percentage points, and then going back up by just under 10 points. With so many turbulent factors in the world – equipment prices, inflation, and the job market to name a few, it’s possible this is creating a lot of instability for newly hired drivers.
What Savvy Carriers Can Do To Improve
Paying attention to both recruiting and retention efforts is a crucial approach amidst the overall climate of change and uncertainty that Q2 has represented.
Recruiting departments should focus on proven methods that work when taking advantage of the uptick of drivers seeking jobs in the market. In addition to using Pulse messaging to communicate with clients, carriers should make the most of Job Store to diversify their advertising (and current clients should schedule a meeting with our Concierge team if they aren’t sure which lead sources are netting them the most success).
Another tool that can help you sort through a growing pool of candidates is Pulse Match, which shows your job postings to candidates who meet the qualifications you’ve set for the position, keeping scattershot applicants out of your pool.
Retention teams should take the time to understand the motivations of newly hired drivers. Review your results in Insights when retention rates suddenly dip. What happened to make drivers dissatisfied? Are the reasons dissatisfied drivers are sharing issues that can be changed internally, or are they a result of external factors? With the current state of inflation, regularly review your current pay structure for new hires to ensure that bonuses and pay rates are set appropriately. Remember to consider the impact of the pay structure for new hires on your tenured drivers to avoid any unintended consequences.
Provided by Tenstreet.
Category: Connected Fleet News, Driver Stuff, Featured, General Update, Management, News, People, Safety, Tools, Training, Transit News
Subscribe
If you enjoyed this article, subscribe to receive more just like it.


